October 15th 2021
In order to get a somewhat clear understanding of the real estate market today, where it’s at, and where it’s going, there are three measuring sticks I’d like to use. The number of units sold over the past month. The average sale price of homes across the region. And the total number of new listings registered in September. By assessing each of those numbers and then comparing them to past months and even past years, we should be in a position to spot trends and perhaps from that extrapolate where things are headed.
First, let’s look at unit sales across Niagara.
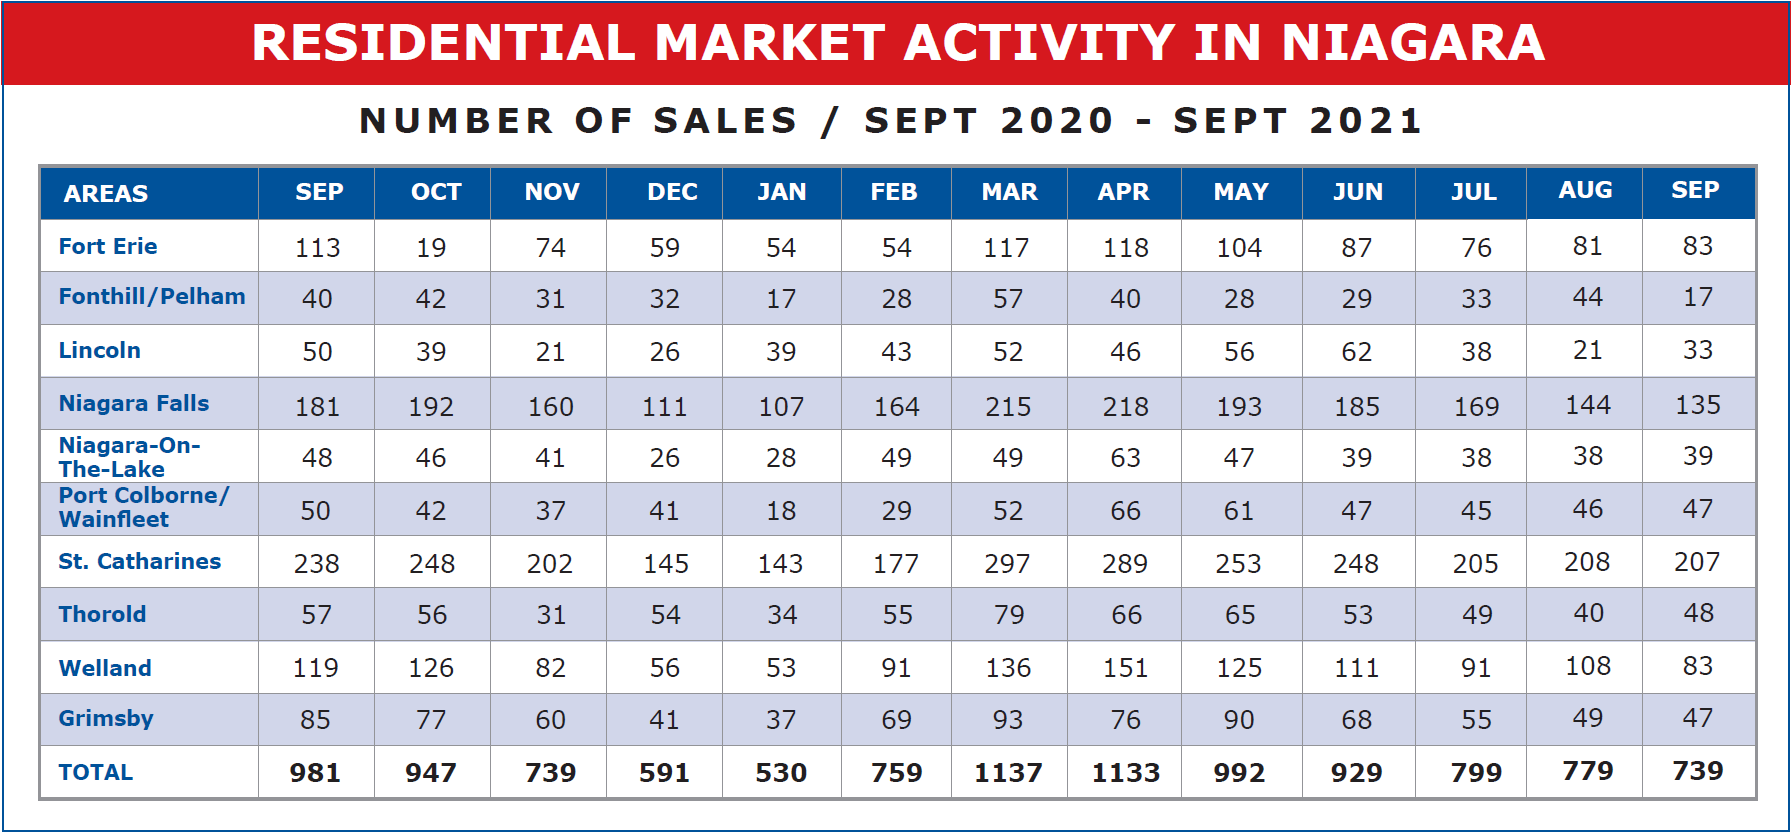
As you can see, the Niagara region registered 739 firm sales in September. That’s down 40 units from the 779 recorded in August. A drop of 5.13%. Nothing really surprising there. In fact, that’s right in line with the sort of drop one would expect moving into the Fall. What is interesting however is that it is down 242 units or 24.67% from September 2020. To understand what is happening you need to factor COVID-19 into the mix. Remember COVID-19 became a reality around mid-March 2020, with the result that the real estate market virtually shut down in April 2020. But pent-up demand was running very high, and as a result, the market rebounded quickly. The net result of COVID-19 in 2020 was that it pushed the normal spring market later into the year. Normally sales would peak in March, April, and May, but in 2020 that peak was delayed to June, July, and August. To appreciate what went on, have a look at the sales figures over the past 5 years as depicted on a graph.
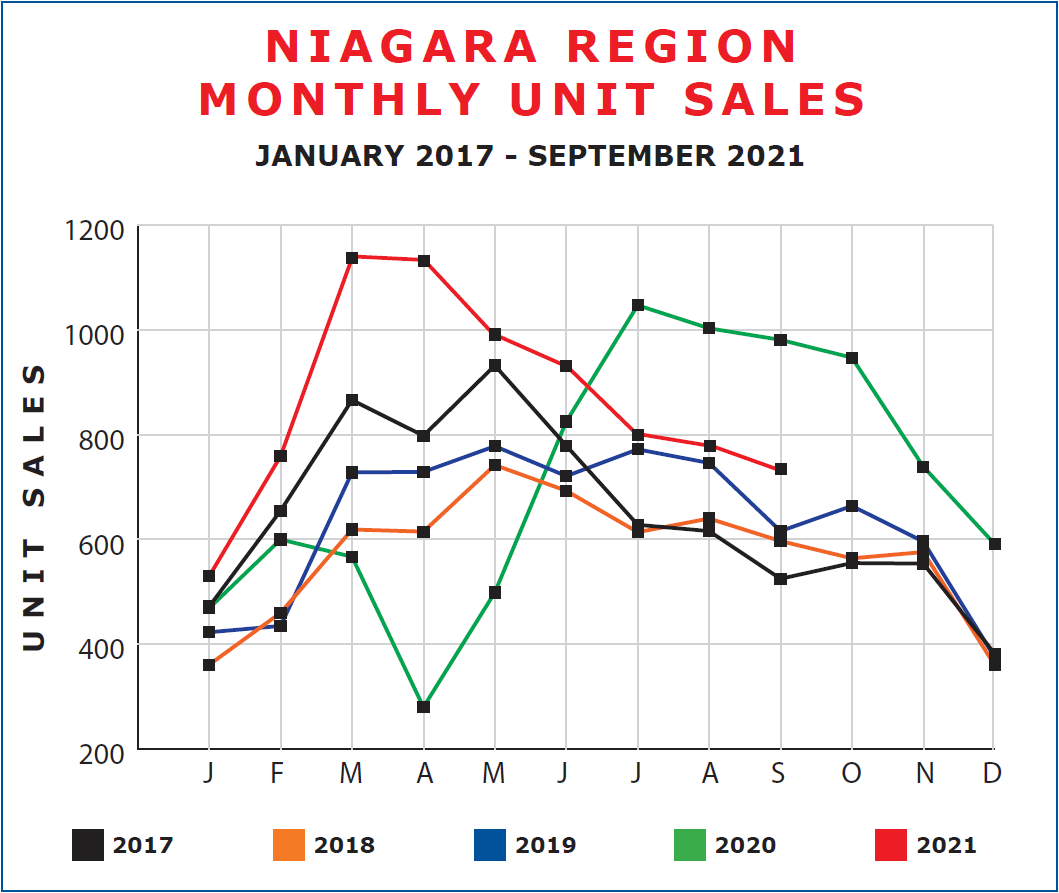
Compare the peak in terms of units sold between 2021 and 2020. 2021 actually registered stronger months overall but in the traditional spring period compared to 2020 when that peak was delayed.
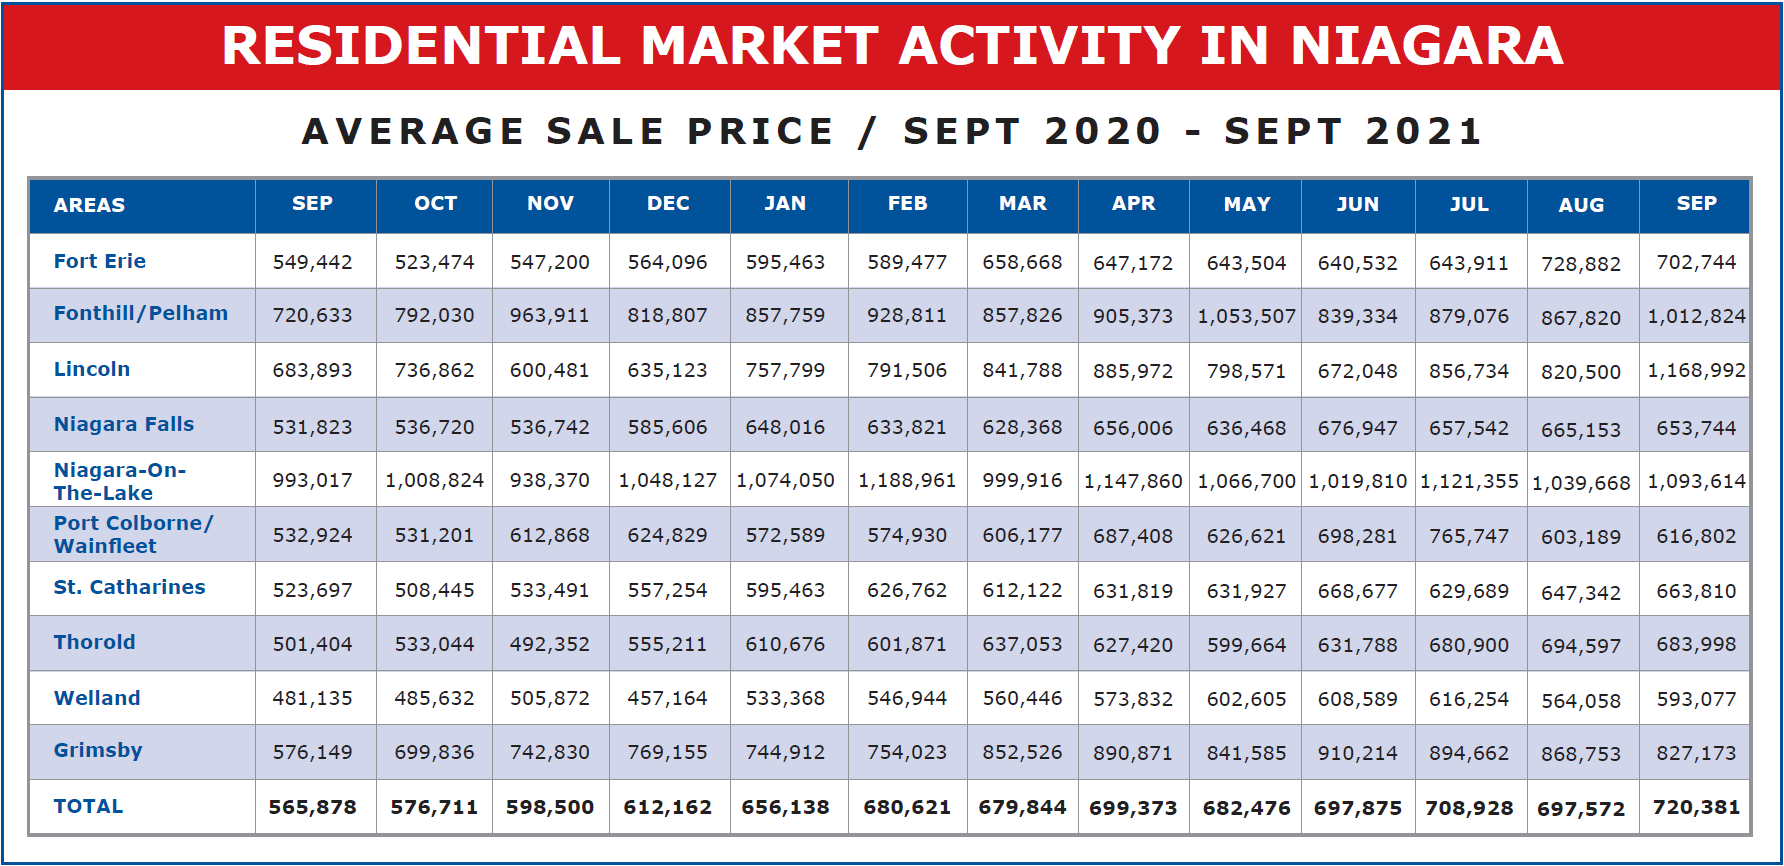
Now let’s look at prices.
Across the Niagara region, the average sale price came in at $720,381 in September. That’s up $22,809 or 3.27% from August. It’s also up a very healthy $154,503 or 27.30% from September of last year. Some of that is just normal volatility which we see from month to month. One month slightly down, another up. This is especially the case on the micro-scale of municipalities, where the sampling is smaller. But I believe this month’s figure is a reflection of something else that is going on, and that relates to reduced inventory. I want to come back to the average price in a minute, but let’s just consider new listings first. September saw a total of 994 new listings come in across Niagara. That’s down 163 units or 14.09% from August. And so while sales are dipping slightly as we approach year-end, so too are listings, and more so. August to September, sales down as we saw 5.13% but listings down 14.09%. And that’s creating a shortage. Back to economics. Supply and demand. When supply decreases more than demand it’s going to put upward pressure on prices and that I believe is what we are seeing in September.
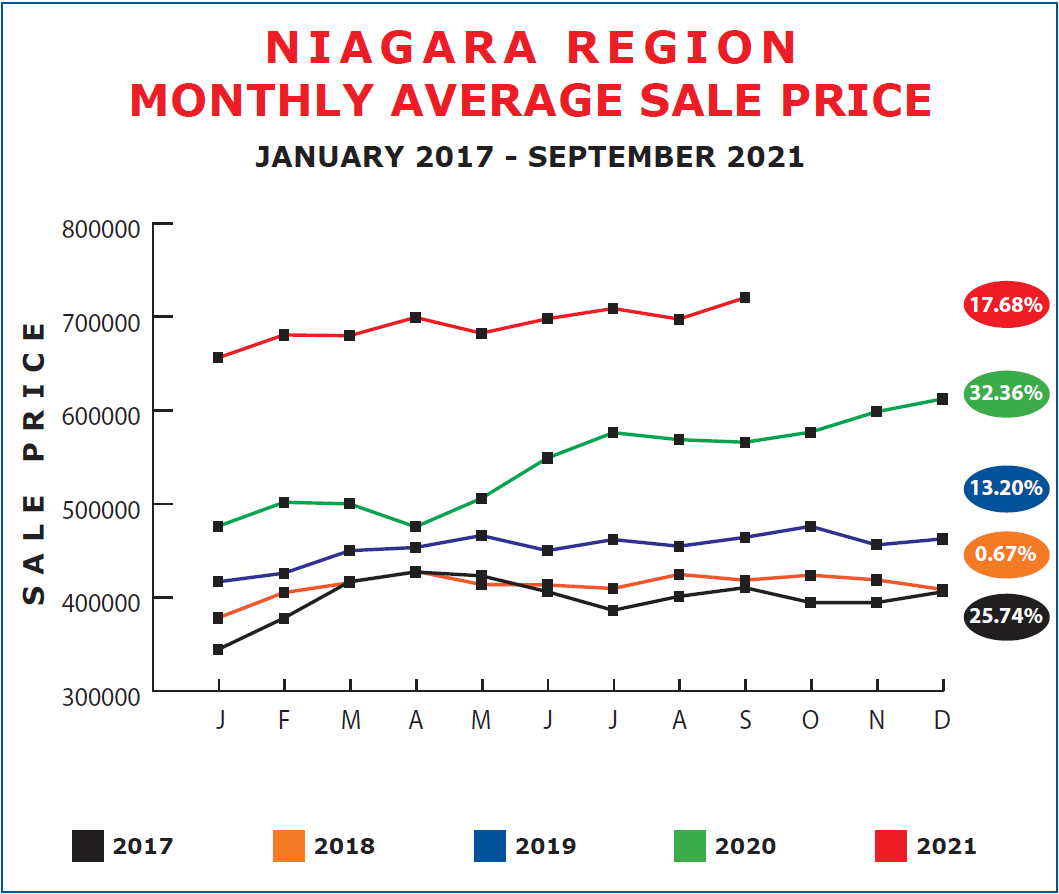
To finish our examination of prices, let’s take a look at price trends in Niagara over the past 5 years.
As you can see in the graph above, prices were very much on the rise in 2017 until the Government introduced the foreign buyer's spec. tax and the stress test for mortgages in April of that year. From that point right through to August, prices slid. Then rebounded slightly toward the end of the year. 2018 saw prices in January a little lower than they ended in 2017 and those prices didn’t rise much over the year. 2019 however saw prices rise pretty steadily throughout the year. And in 2020 prices absolutely accelerated.
To give a better sense of the gains made in price year over year, I’ve worked out the average increase in price for each year, beginning with 2017. Now for those of you who are mathematicians, I should point out, I calculated yearly increase based on year-end of that year compared to year-end of the previous year, otherwise, we’d be dropping a month each year. Those percentage increases are shown at the end of each year’s graph line. Substantial gains were made each year with the exception of 2018. And in each year except 2018, a major gain occurred in the month of January. 2017, 2018, and 2019 all saw prices pretty level over the second half of the year, while 2020 made some gains in the last couple months of the year. 2021 while dipping slightly in August, saw an upsurge in September to our all-time record of $720,381. All things being equal we should see some modest increases over the balance of the year, and don’t be surprised to see strong gains again in January 2022.