April 15th 2024
Opening up the Niagara Association of Realtors website, one of the things you are greeted with is a graph depicting market activity over the past year based on Median Sales Price. The current graph is surprising
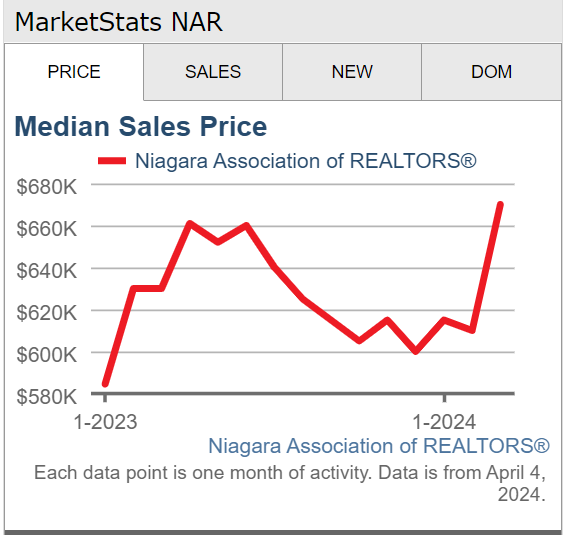
As you can see both 2023 and 2024 started off with substantial price gains. In fact, those gains were pretty consistent over the first 6 months of 2023. But looking at 2024 the graph shoots up at a much steeper angle and reaches higher levels than it did in the corresponding 1st quarter of 2023. And that’s before the promised interest rate cuts have come into effect.
When you look at the actual average sale prices for the first quarter, as opposed to Median prices, the gains aren’t quite as startling, but still pretty impressive.
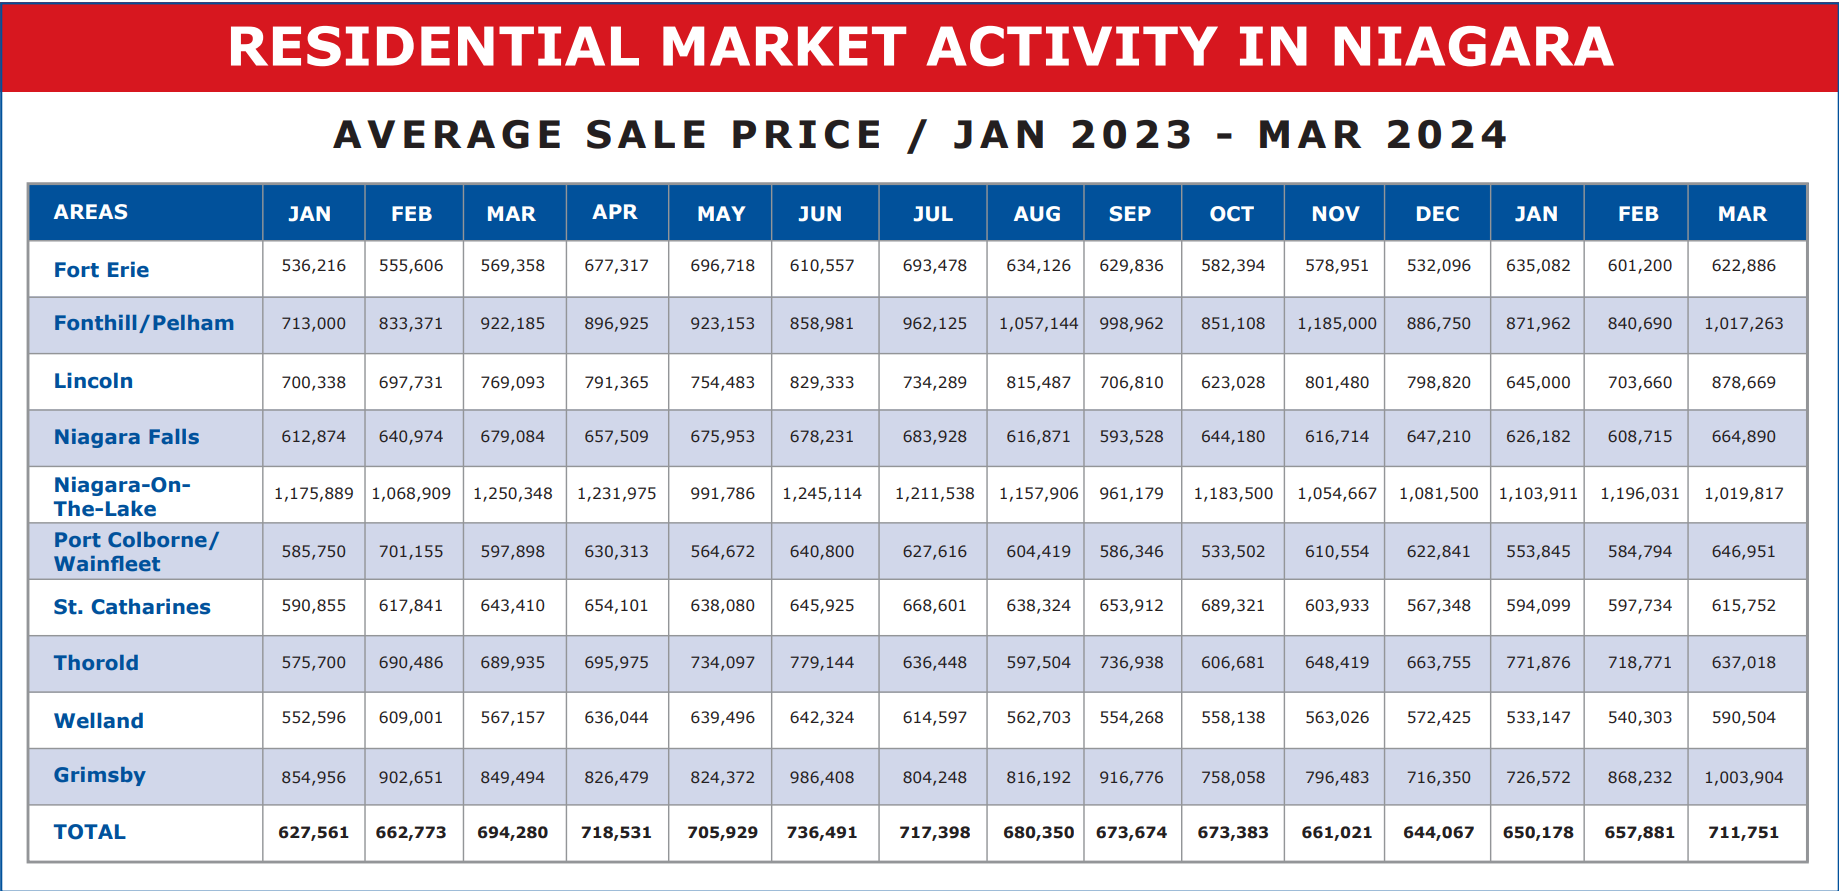
As you can see from the chart above, the average residential sale price across the region came in at $711,751 in March, up from $657,881 in February. That’s a gain of $53,870 or 8.19%. Very respectable for one month. And it actually compares favourably to the $694,280 registered one year ago, March 2023. A gain of $17,471 or 2.52% year over year. Of course, it’s quite common to see price gains over the first half of the year, and last year that momentum carried the prices right up to $736,491 in June 2023.
It will be interesting to see how that momentum works out in the next few months especially as interest rates begin to ease.
The other indicator that I like to track each month is unit sales.
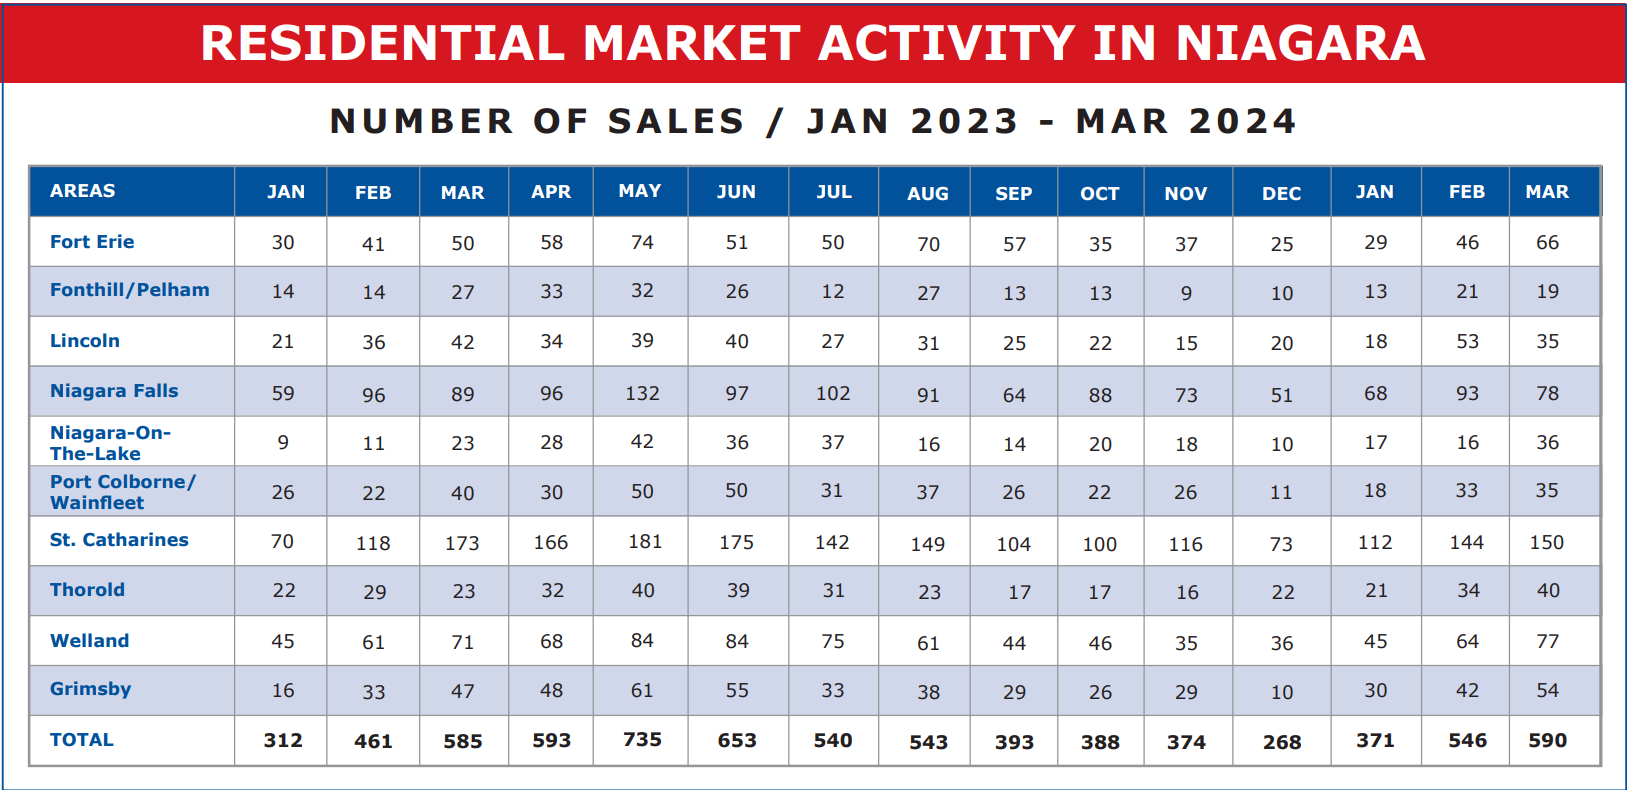
As you can see, March came in at 590 residential sales across the region. That’s up 44 units or 8.06% from February. What’s interesting however is how that compares with the same period in 2023. March 2023 recorded 585 unit sales. Almost identical to this year. But last year March was up 124 units or 26.90% from February. So, was it just that last year was off to a sluggish start or is it that the market acceleration was higher in 2023 that it is this year?
April sales figures will be interesting to see. Last year April sales were pretty much in line with March, but then spiked in May. In all likelihood this year will follow suit with activity increasing over the next few months, but the irregularity in the figures serves to illustrate the uncertainty that prevails in the consumer’s mind. I maintain buyers and sellers alike are very anxious to get back into the market, but are waiting for some signal of clear direction. Sustained price increases, interest rate cuts. Both will definitely spur the market on. And both are definitely on the way. This year in all likelihood we will see those trends materialize. Which month it will begin to happen however is largely in the hands of the Bank of Canada.