December 15th 2021
The market stats are in for the month of November and there are really no surprises. We would expect things to slow somewhat into the late Fall and as we approach the Christmas season and that’s what has happened.

Across the region, a total of 697 sales were recorded in the month of November. That’s down 139 units or 16.63% from October. By comparison, that number is actually down 42 units or 5.68% from last November.
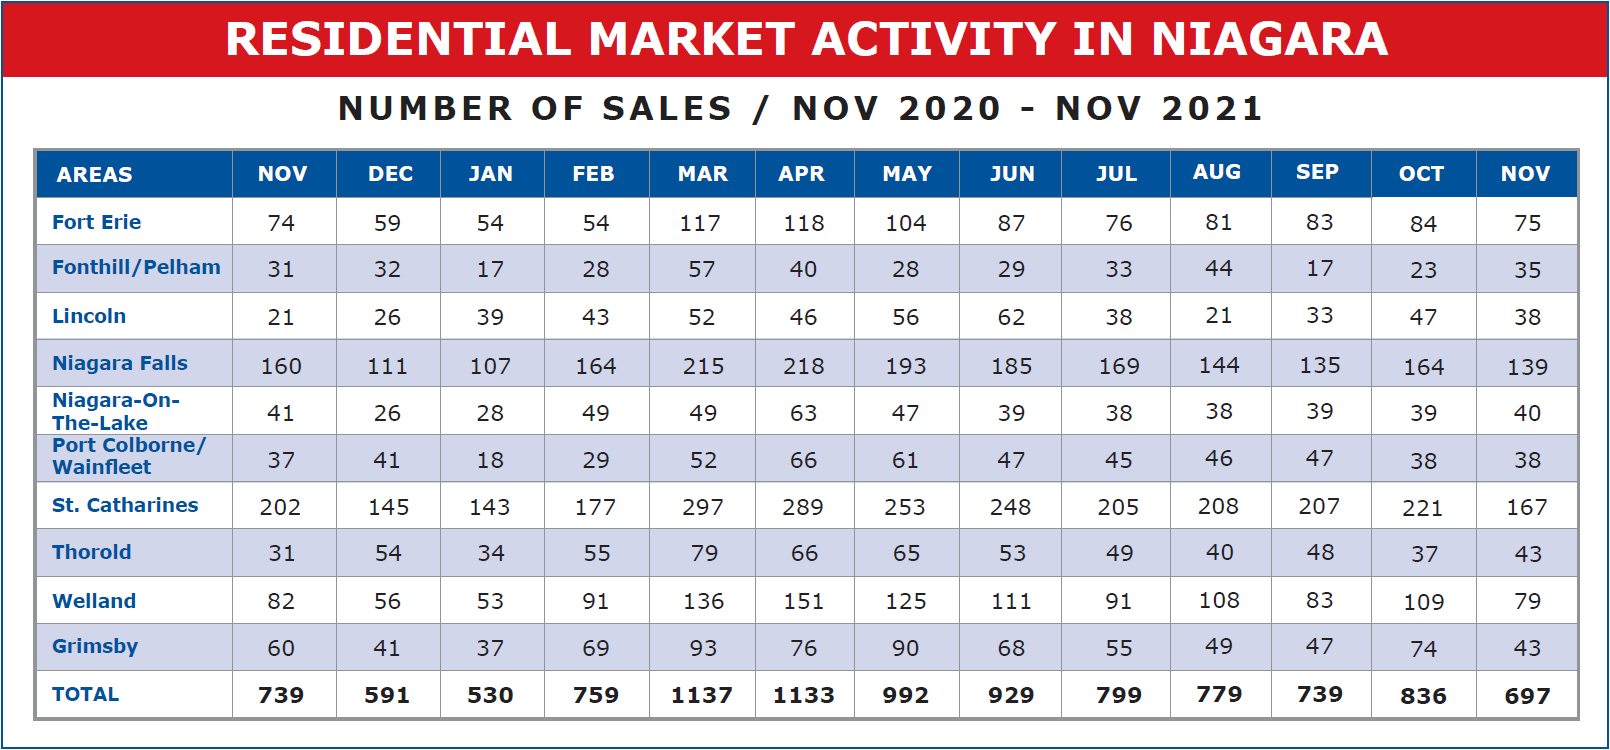
What is interesting however is that last year, the month of November registered a drop of 208 units or 21.96% from the month of October. So, in both years, we saw a deceleration of activity from October to November, but that reduction was actually more pronounced last year. There’s nothing particularly surprising about this trend. It’s reflective of the time of year. The onset of cold weather. The approach to Christmas and year-end. And in fact, that slowdown will be even more evident in December.
As we normally do, let’s have a look at the unit sales as expressed in graph format.
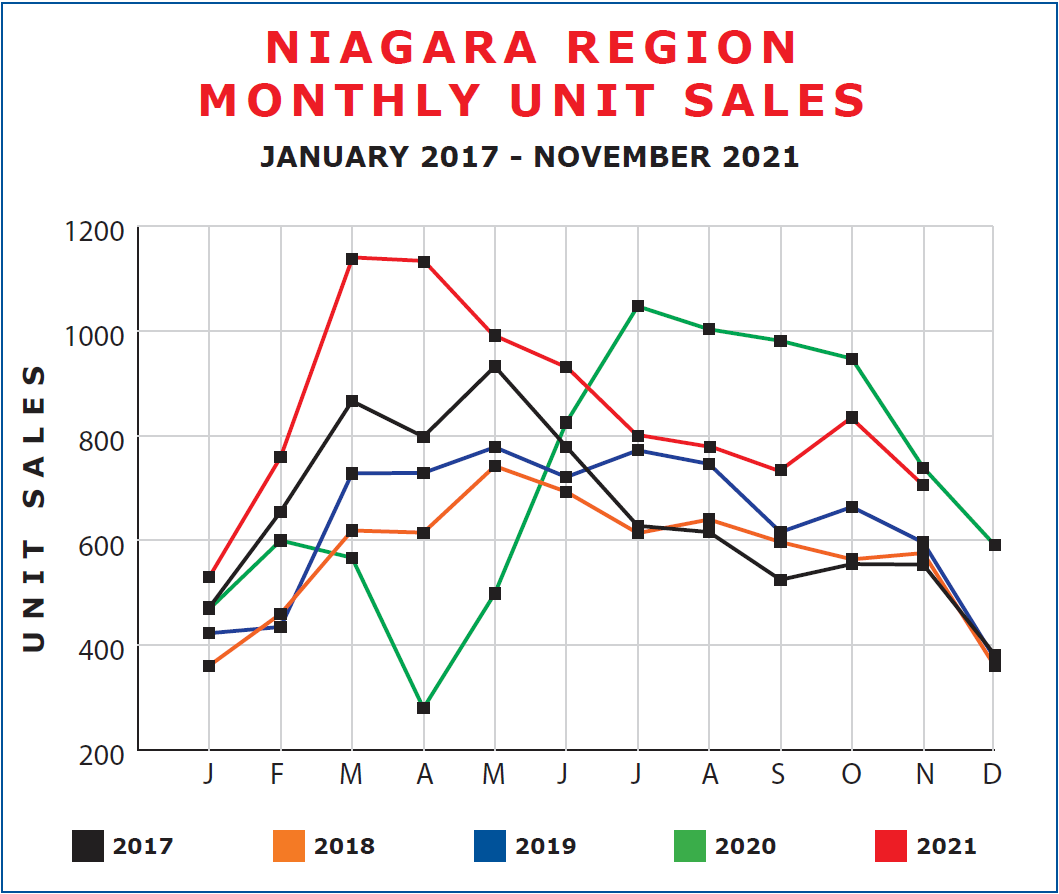
What’s interesting and unusual from the graph is the fact that both 2017 and 2018 defied the norm and actually registered an uptick in activity in November. That’s not what usually happens. The other interesting observation from the graph is that while down, November 2021 in absolute terms was still the second-highest in sales volume of the last 5 years, only slightly lower than last year. So seasonally, a slowdown, but still quite robust.
Now let’s move on to price. The average residential sale price across the Region came in at $745,970 in November. And while that’s the second-highest figure on record and almost $25,000 above September, it does reflect a drop in the price of $7,090 or 0.94% from October.
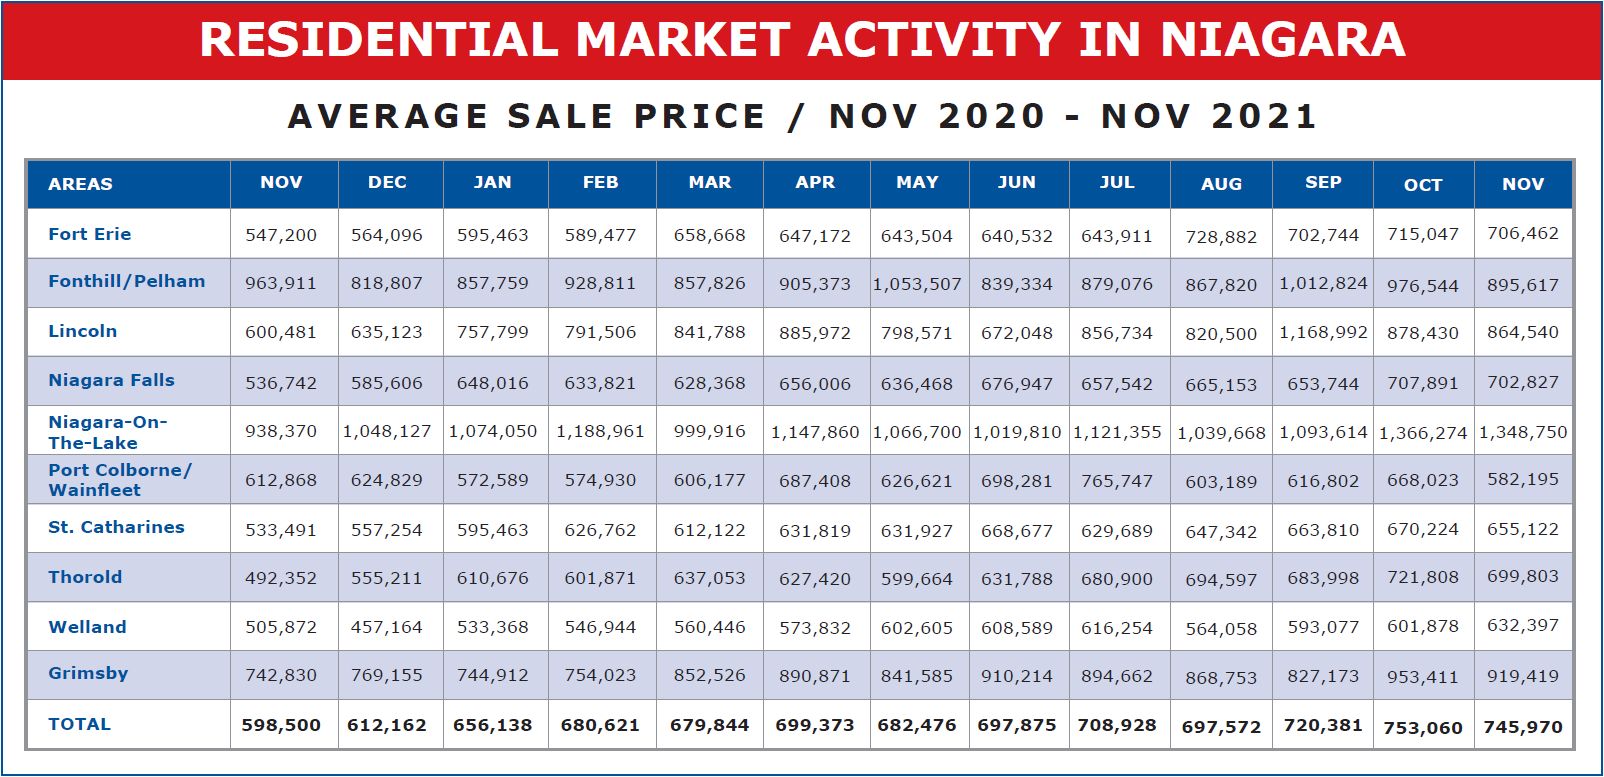
Less than 1% is really in and of itself insignificant. Of course, if that happened every month it would trend to a cumulative total of over 12%. But I don’t believe that is what is happening here. Swings in the realm of 1% are really indicative of natural fluctuations due to unique sales which can skew the numbers. Over the course of 2021 on three other occasions, March, May, and August the average sale price dropped from the previous month, only to gain ground the next. In fact, from the end of 2020, where the average sale price in the region was $612,162, we’ve seen the market increase by 21.86% in 2021.
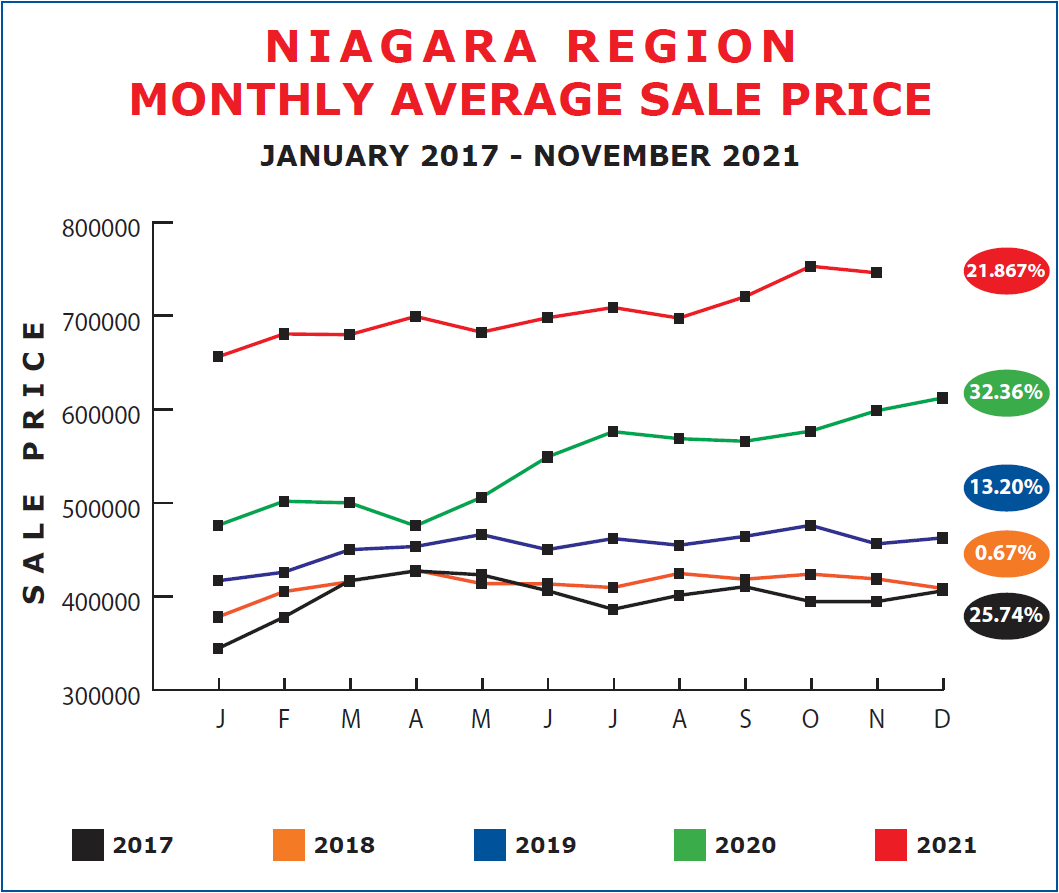
As you can see in the above graph, each year saw prices vacillate from month to month, occasionally down one month but up the next and always trending upward. In 2017 the price remained pretty much flat from October to November. 2018 and 2019 both saw prices trend downward in November. 2020 saw price gains. All but 2018 saw upward movement in December. That was remarkable. It’ll be interesting to see how prices behave in December of this year.
One last thing that I think is noteworthy deals with listings and listing inventory. I don’t normally check listing inventory because it isn’t totally accurate. The number of listings taken any given month doesn’t show how many are re-listed or re-serviced inventory. However, assuming that percentage doesn’t vary that much from month to month, it does give us an idea of what is going on with available inventory. We saw in our last newsletter that September saw a reduction of 14.09% new listings compared to August, and October registered a further drop in new inventory of 13.08%. Now too in November, the region took in 751 new listings, down 13.08% from October. What is very interesting however is that 751 figure is actually up 87 units or 13.10% from November 2020. A trend we haven’t seen.
So, what should we watch for moving ahead? Well, as we’ve seen, December will no doubt register a drop in activity which will carry through into January. That’s simply a reality of year-end. Prices, I fully expect will remain strong into year-end, and gain significant ground into the spring. I fully expect 2022 to be another solid year in real estate, with two unknowns yet to be factored in. Covid and Government intervention.