February 15th 2022
It looks like the pundits were wrong! At least the data coming in from the first month of 2022 it would appear that way. From the vantage point of 2021, the forecasters were anticipating a slight moderation in the acceleration of house prices over 2022, coming in at around the 8%-10% range. Still a very healthy return on one’s investment but not the 20%-30% increases we’ve seen in 2020 and 2021. But look at what has happened.
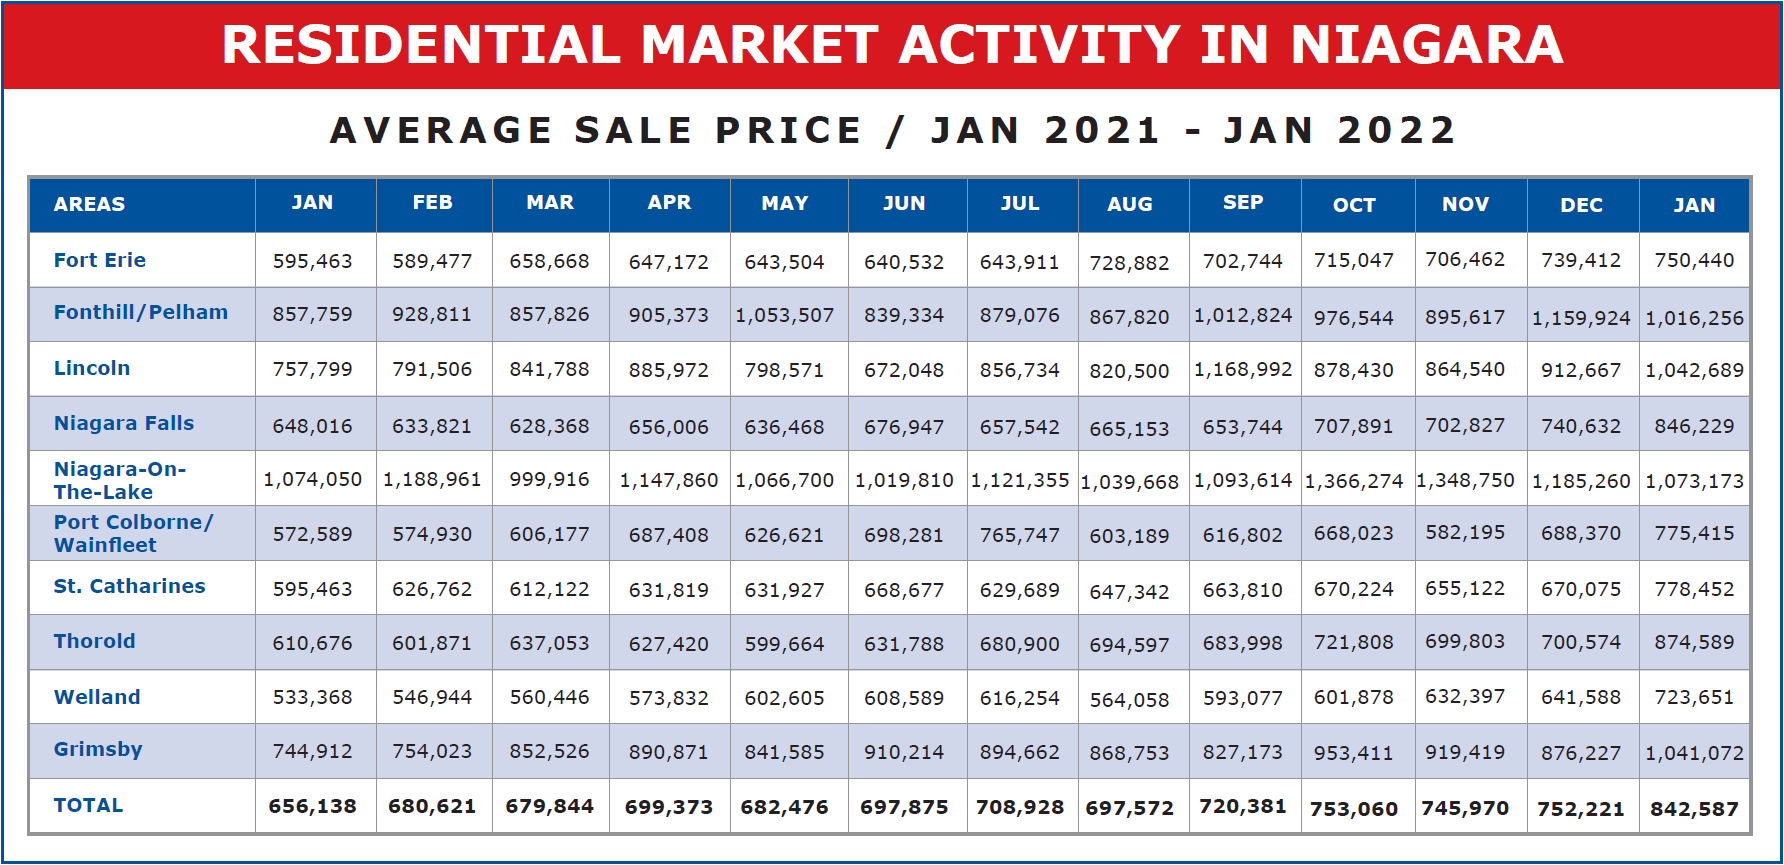
The month of January exhibited a month-over-month gain from December of $90,366 or 12.01%. That’s in just one month. In my 40+ years in this business that’s the largest one-month gain, I can ever recall seeing. And, of course, there is a variation from municipality to municipality. But look at the two largest in the Niagara Region, St. Catharines and Niagara Falls. In December, St. Catharines recorded an average residential sale price of $670,075. January ended with an average sale price of $778,452. An increase of $108,377 or 16.17%, and Niagara Falls ended 2021 with an average sale price of $740,632, and just one month later, that average had grown to $846,229. An increase of $105,597 or 14.26%.
To get the full impact of what is happening to average sale prices in the Niagara Region, let me show you a graph provided by our local Niagara Board which tracks average prices over the past 3 years 2019, 2020, and 2021 and on into the first bit of 2022 to Feb 7, 2022.
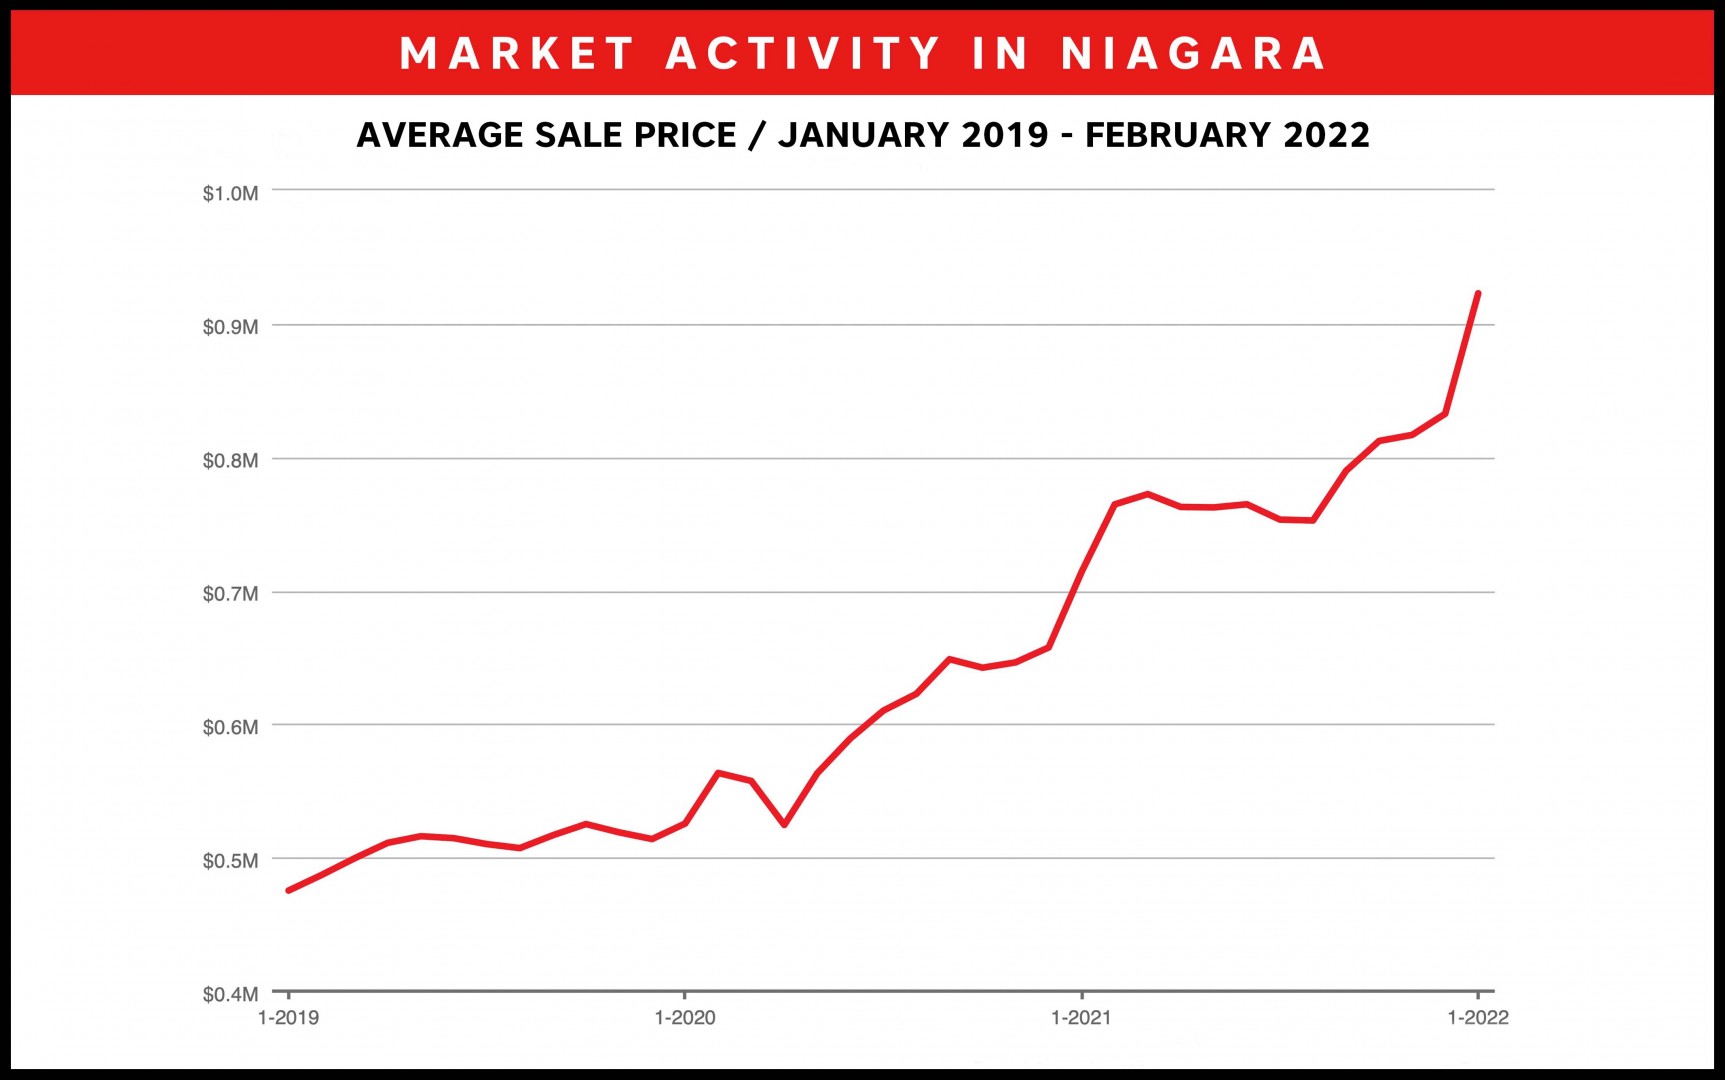
As we’ve seen previously, in 2019 prices were relatively flat, but did register overall an increase in excess of 10%. 2021 and 2022, the first few COVID years saw pretty steady increases with the exception of April 2020 when the Pandemic hit. But look at 2022. The graph is almost vertical since the start of the year.
Now there are two factors to take into consideration which have contributed to this run-up in price and they are related. Inventory and sales volume. In January 2022 the Board took in a total of 529 new residential listings. That is down 87 units or 14.12% from last January. And correspondingly the total number of sales across the region came in at 472 units down 58 units or 10.94% from a year ago. Assuming there is no decrease in demand (number of buyers) that means buyers have fewer properties to choose from, and the existing inventory is therefore in greater demand, pushing prices up.
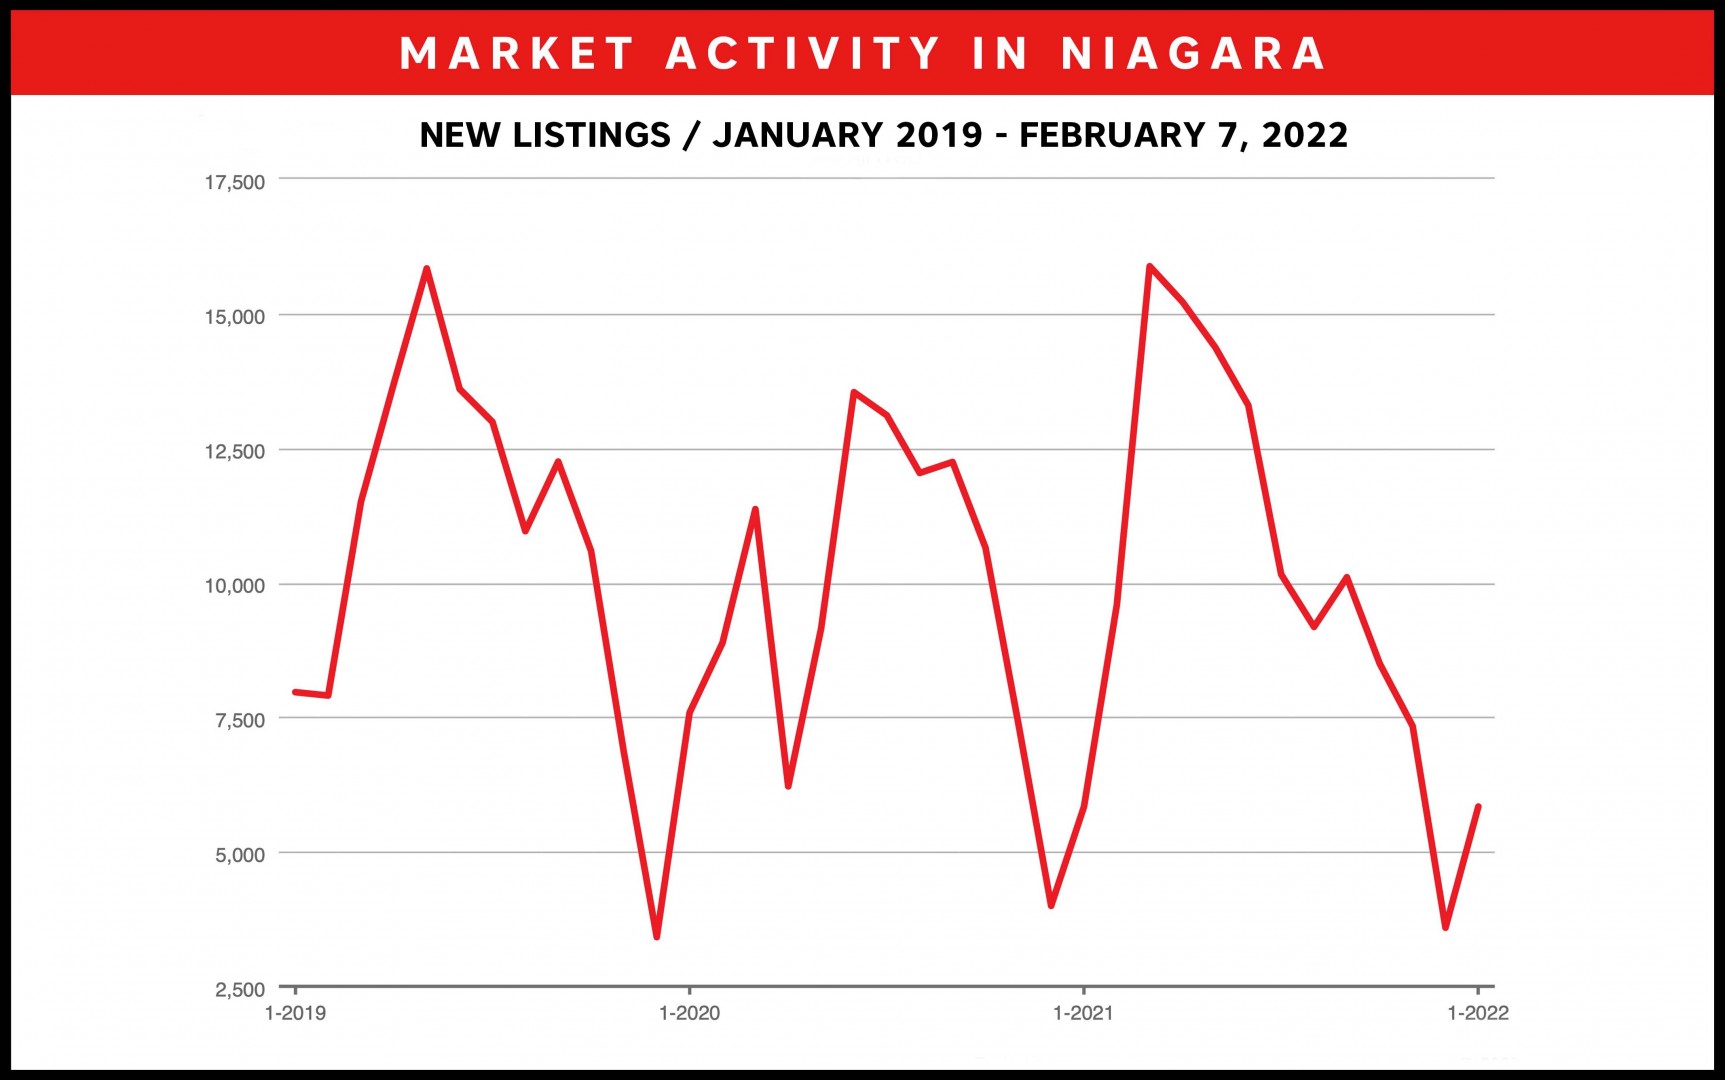
So what’s ahead? Well, the next couple of months will be interesting to watch. Traditionally we think of the spring market as being the busiest. Beginning any time now, we should begin to see a marked increase in inventory as new listings come cascading onto the market. As you can see from the attached graph, inventory really spikes up very early into the new year. That’s beginning to happen in 2022 and will no doubt accelerate.
With prices already exceeding expectations for the whole year, it will be interesting to watch what happens into the spring. Stay tuned.