January 15th 2021
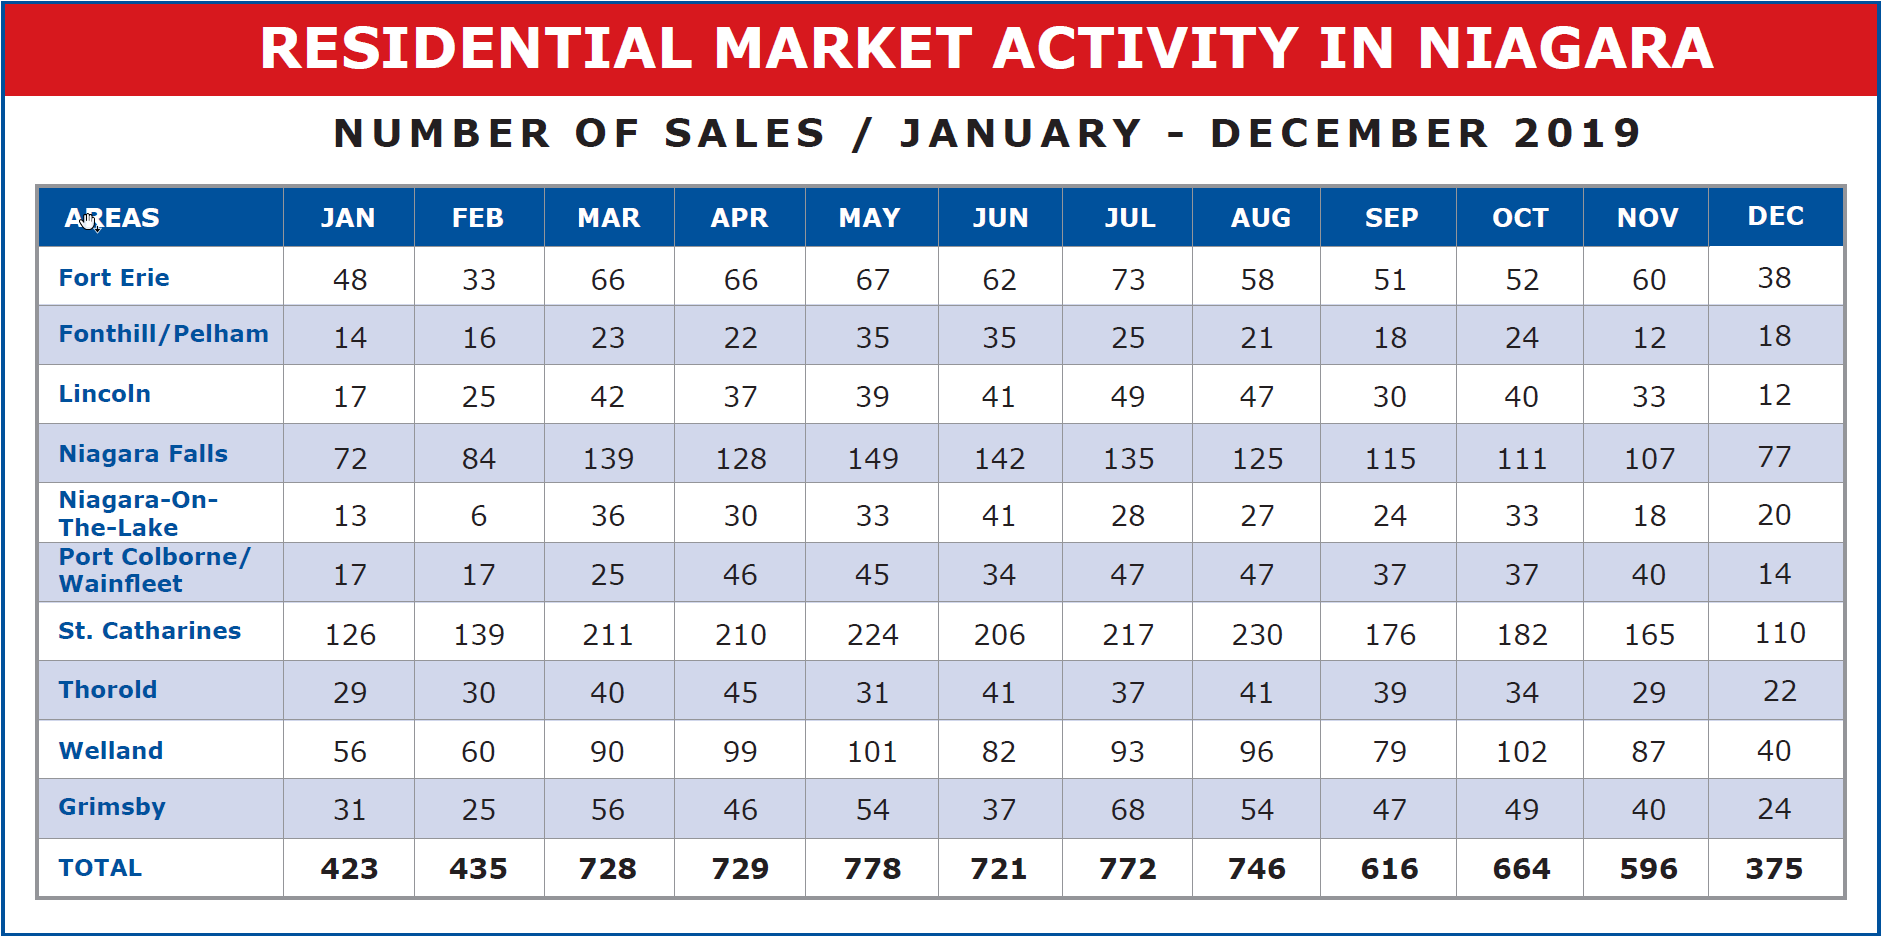
The sales figures are in for December and they are truly remarkable, both in number of units sold and also in average sale price across Niagara. Normally we would see a significant slowdown in sales activity over the month of December. Things really slow by mid-December and then pretty well shut down over the Christmas season. And while sales did definitely slow in December when compared to the previous month, that slowdown was not nearly as drastic as one might expect. Across the region we saw a total of 591 sales recorded in December. When compared to the 739 registered in November, that represents a reduction of 148 units or 20.03%. However, when we compare it to December 2019 where 375 sales were recorded, we see this years December sales are actually up by 57.6% year over year. That is truly remarkable. And it speaks to the underlying strength in the marketplace and the pent-up demand that continues to drive the market upward.
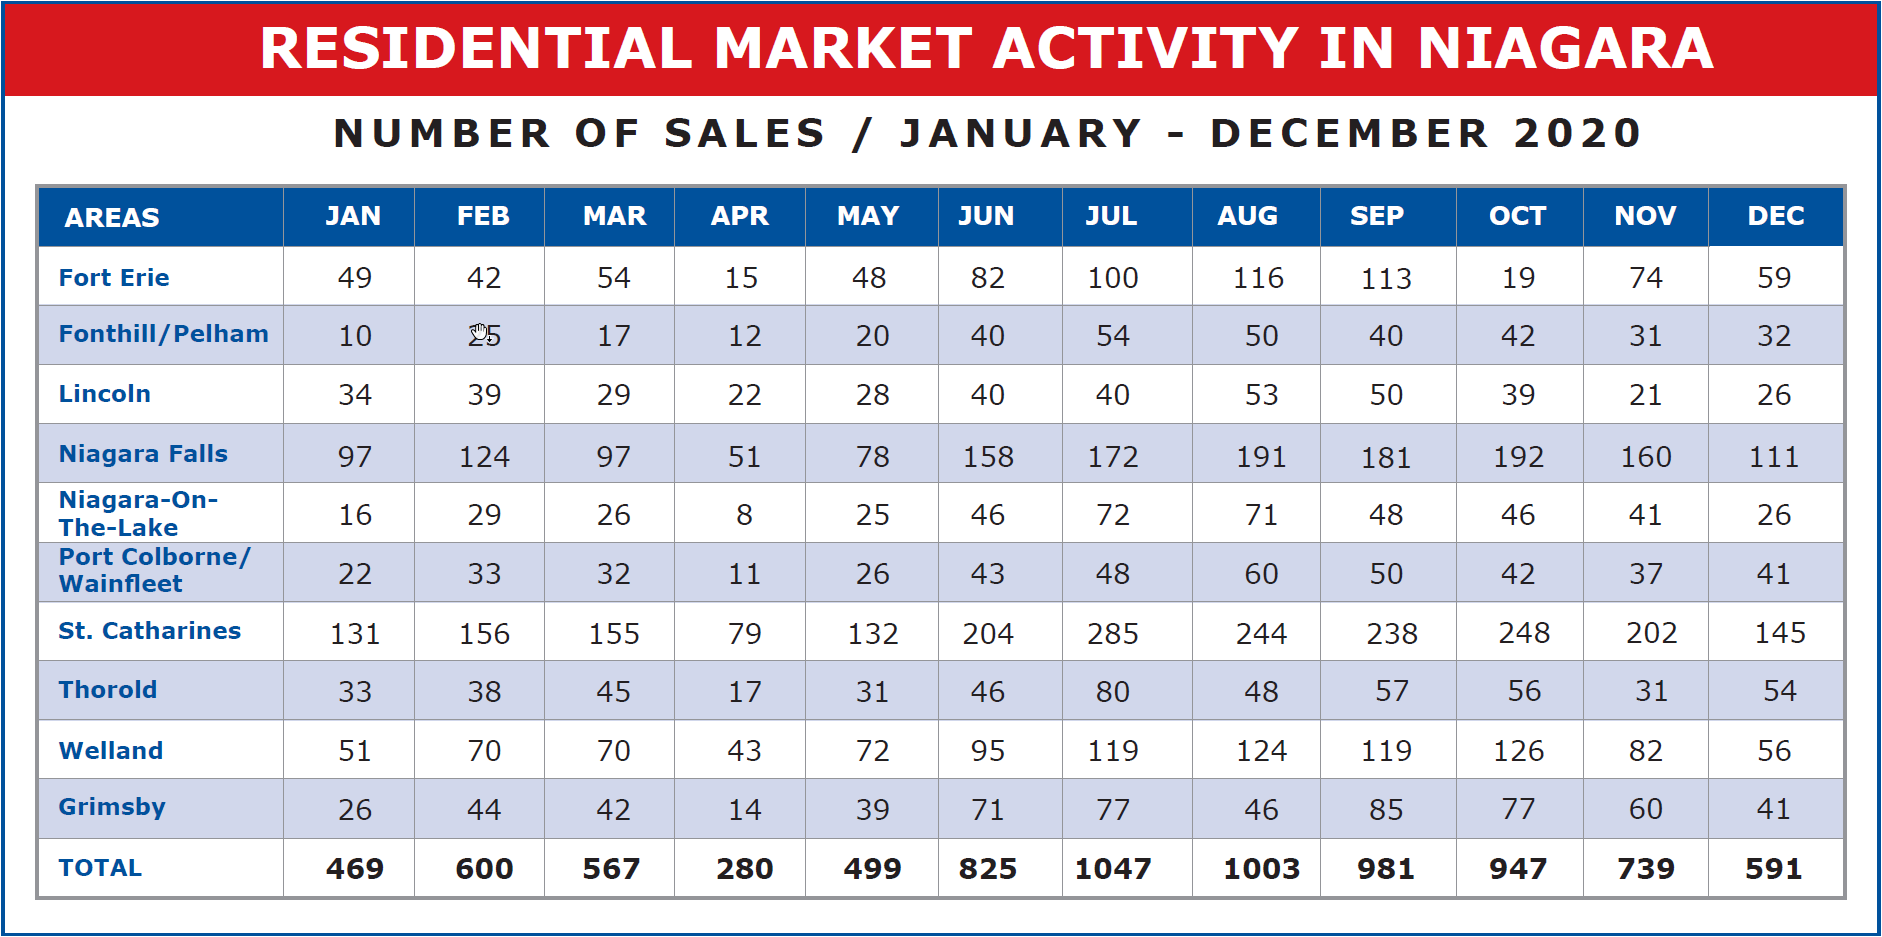
*Sales data provided by the Niagara Association of Realtors and the Hamilton-Burlington Realtors Association as submitted through Brokerage Members inputted MLS sales.
Do we need to be alarmed? There is always a segment of the population that points to a very robust marketplace and warns of a pending correction. The market is certainly hot. Is it too hot?
We need to understand that at any given time the residential market is composed of end-users, that is first time buyers, move-ins, move-away, or people looking to reconfigure. Then there are renovators, speculators and investors. It is primarily the renovators and speculators that add instability to the marketplace. I’m not faulting them. They have a role to play. But they are like day traders in the stock market. They jump in when the market is hot and jump out when they feel nervous.
To understand the composition today, let's look at total sales figures over the past 5 or 6 years.
| YEAR | UNITS SOLD | MARKET ISSUES |
| 2015 | 7736 | Market just beginning to heat up |
| 2016 | 8912 | Market very robust |
| 2017 | 7762 | Spec tax & stress test dampen the market |
| 2018 | 6841 | Market begins to again ramp up |
| 2019 | 7583 | Market back to normal levels but gaining steam |
| 2020 | 8548 | Covid slows market, only temporarily. Gaining momentum |
I expect from this we are going to see the activity continue to accelerate through 2021 much as we were seeing in early 2017 before the government introduced two powerful declaration forces. And of course, we can’t guarantee they won’t do something like that again, but otherwise, we are in the upswing of a very strong market driven by excellent mortgage rates and remarkable price gains.
And speaking of price gains, what we see going into the end of the year 2020 is again nothing short of remarkable. Normally as we’ve seen, most of the price gains realized over the course of a year occur in the first half, with the second half being more or less level. But not this year. Here the last three months of the year have seen market prices climb and climb.
Consider across the region, average prices:
October $576,711
November $598,500
December $612,162
When we compare to June’s $548,975 figure we see the region registered gains of 11.5% in the last 6 months alone and compared to the average sale price of $462,505 back in December 2019 that’s a year-over-year increase of 32.36%

*Sales data provided by the Niagara Association of Realtors and the Hamilton-Burlington Realtors Association as submitted through Brokerage Members inputted MLS sales.
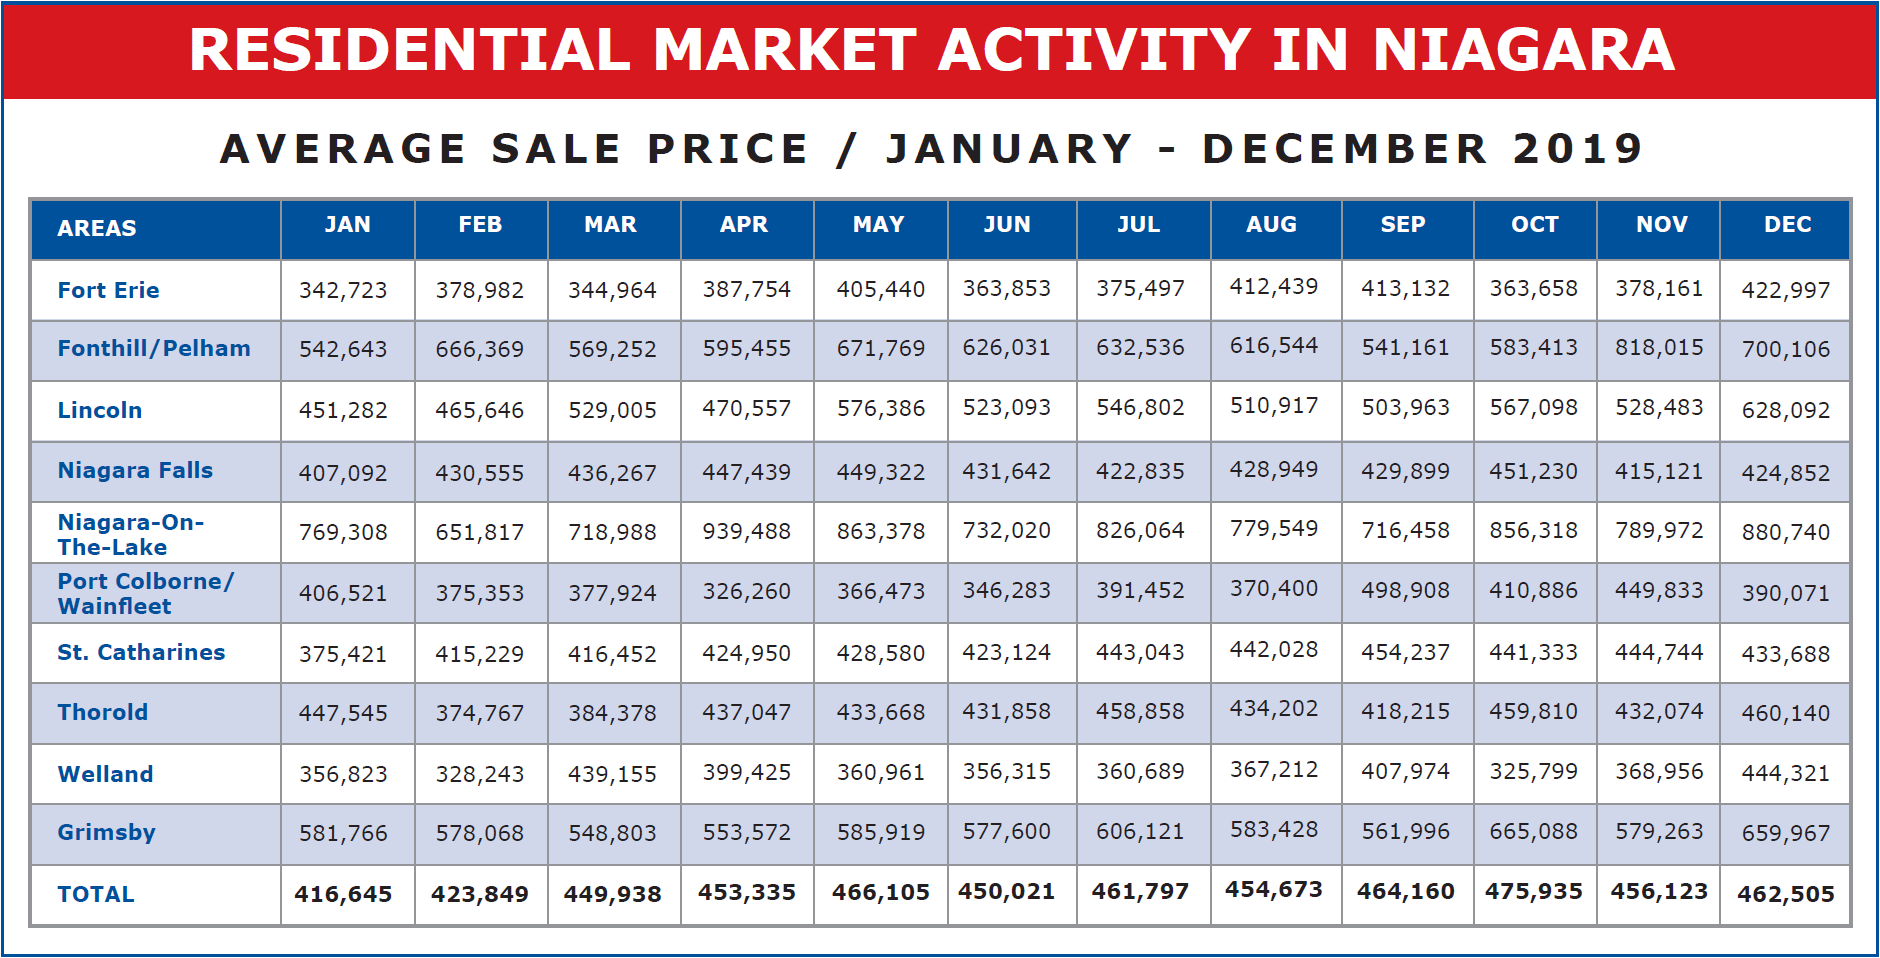
*Sales data provided by the Niagara Association of Realtors and the Hamilton-Burlington Realtors Association as submitted through Brokerage Members inputted MLS sales.
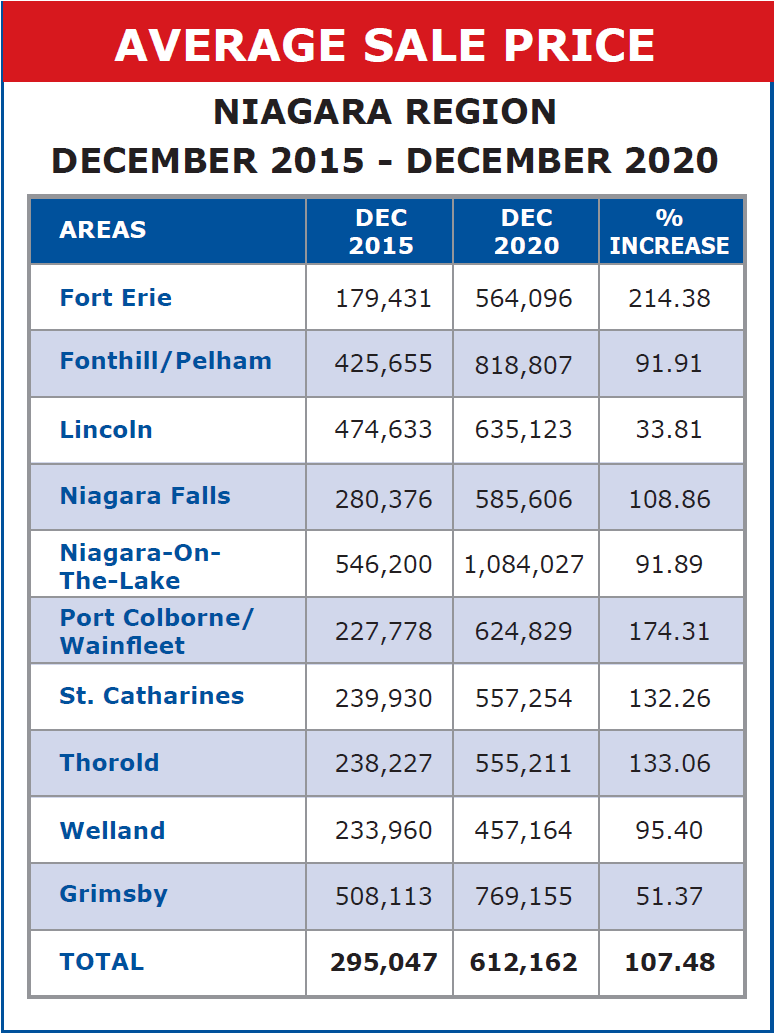
But if we really were to understand the full impact of how prices have increased across Niagara, let’s look at each municipality and see how prices as of Dec 2020 compared to what they were just 5 years ago in 2015.
 |
 |
*Sales data provided by the Niagara Association of Realtors and the Hamilton-Burlington Realtors Association as submitted through Brokerage Members inputted MLS sales.
In the smaller municipalities the figures aren’t as reliable since fewer sales any given month give rise to more volatility in average price, but look at the largest municipalities, St. Catharines and Niagara Falls up 137.26% and 108.86% respectively and the region as a whole up 107.48% in just 5 years. And that uptick would appear to be accelerating. Speaks well of the days and months ahead.