January 17th 2022
Last month, you may recall, we saw a slight dip in the average sale price across the region, down in November to $745,970 from the $753,060 figure in October. A drop of less than 1%, but a drop nonetheless. And, in fact, that drop was reflected in every one of the municipalities we track across Niagara, with the exception of Welland.

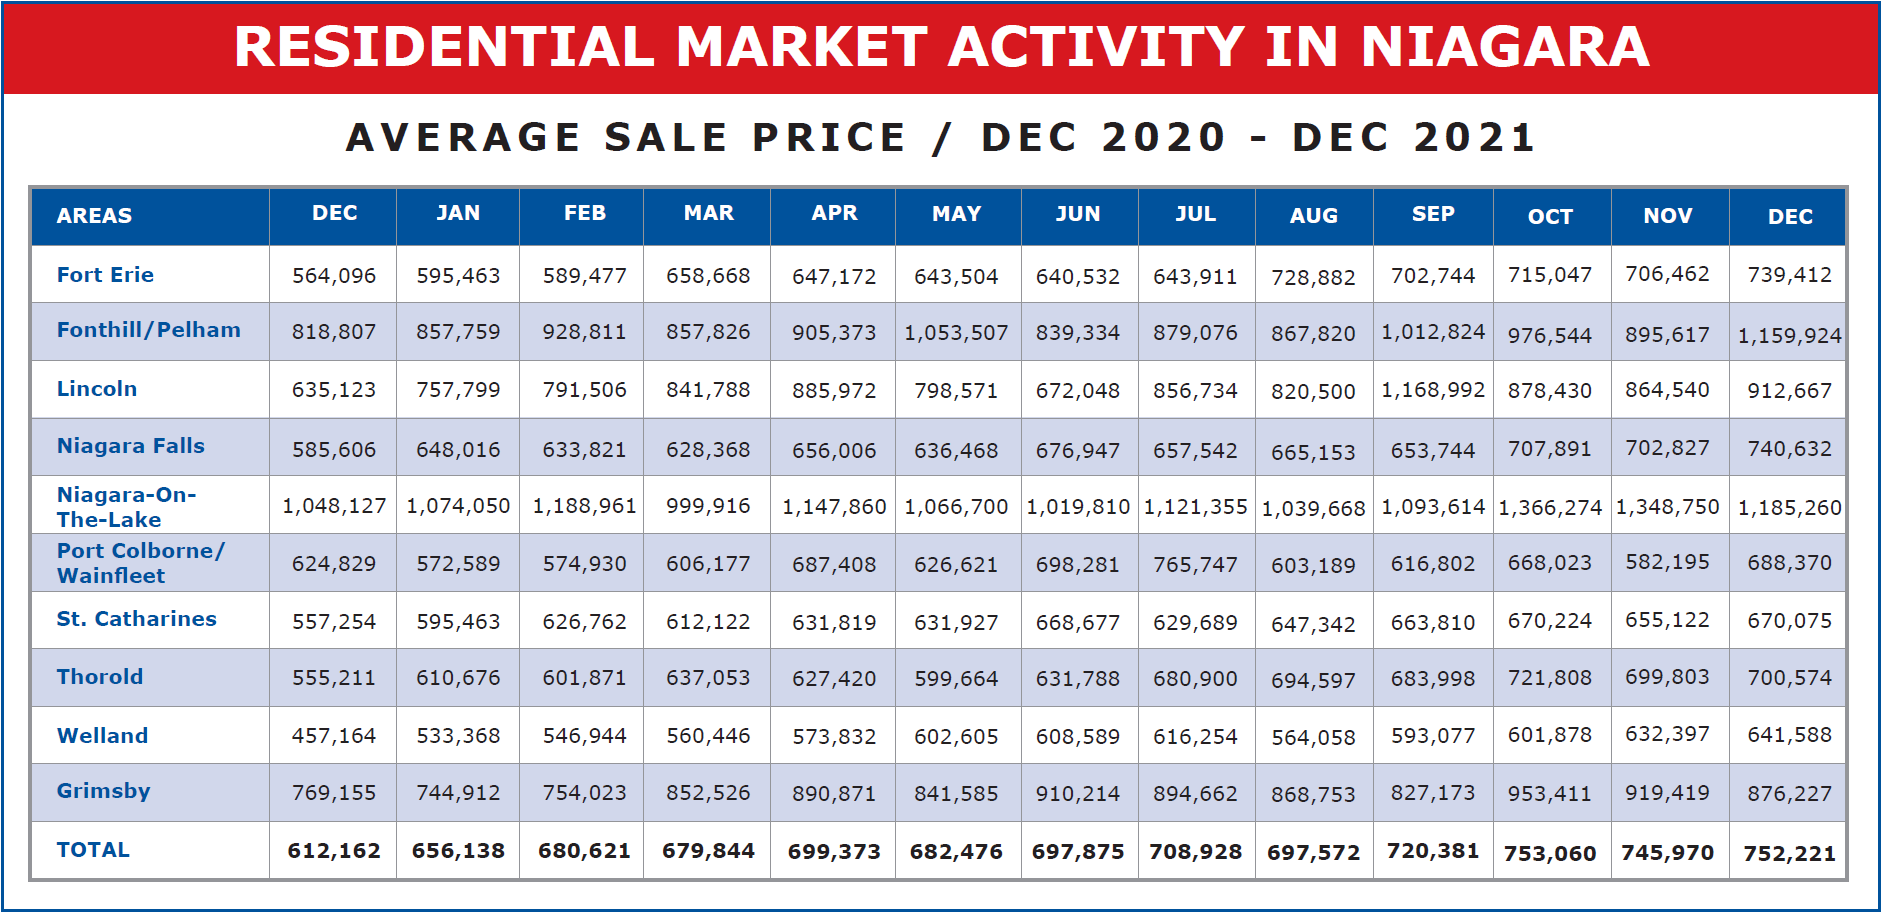
What is quite remarkable however is what has happened to average sale prices over the past two years. 2020, the year the world was introduced to the Corona Pandemic, the market should have been devastated, you would think. And, in fact, it was. For a couple of months. While everyone tried to figure their way around the new reality, real estate sales almost stopped, for the months of March and April. But then it came roaring back with a fervor we had seldom seen. 2019 ended with average sale prices across the region logging in at $462,505. By the end of 2020, just one year later, that average had risen to $612,162. An increase of $149,657 or 32.36%. No doubt one of the highest year-over-year increases ever recorded in Niagara, and during a worldwide pandemic the likes of which the world hasn’t seen in 100 years.
Now on to 2021. As we’ve seen, the previous year ended at $612,162. Well, in like manner 2021 at year-end recorded an average sale price of $752,221. An increase of $140,059 or 22.88%. Overall, that means, on average the prices in Niagara during that 2-year pandemic period went up from $462,505 to $752,221. An increase of $289,716 or a remarkable 62.64%.
To get a better handle on the impact the past 2 years has had on the marketplace, let’s look at the recorded monthly averages depicted in graph format.
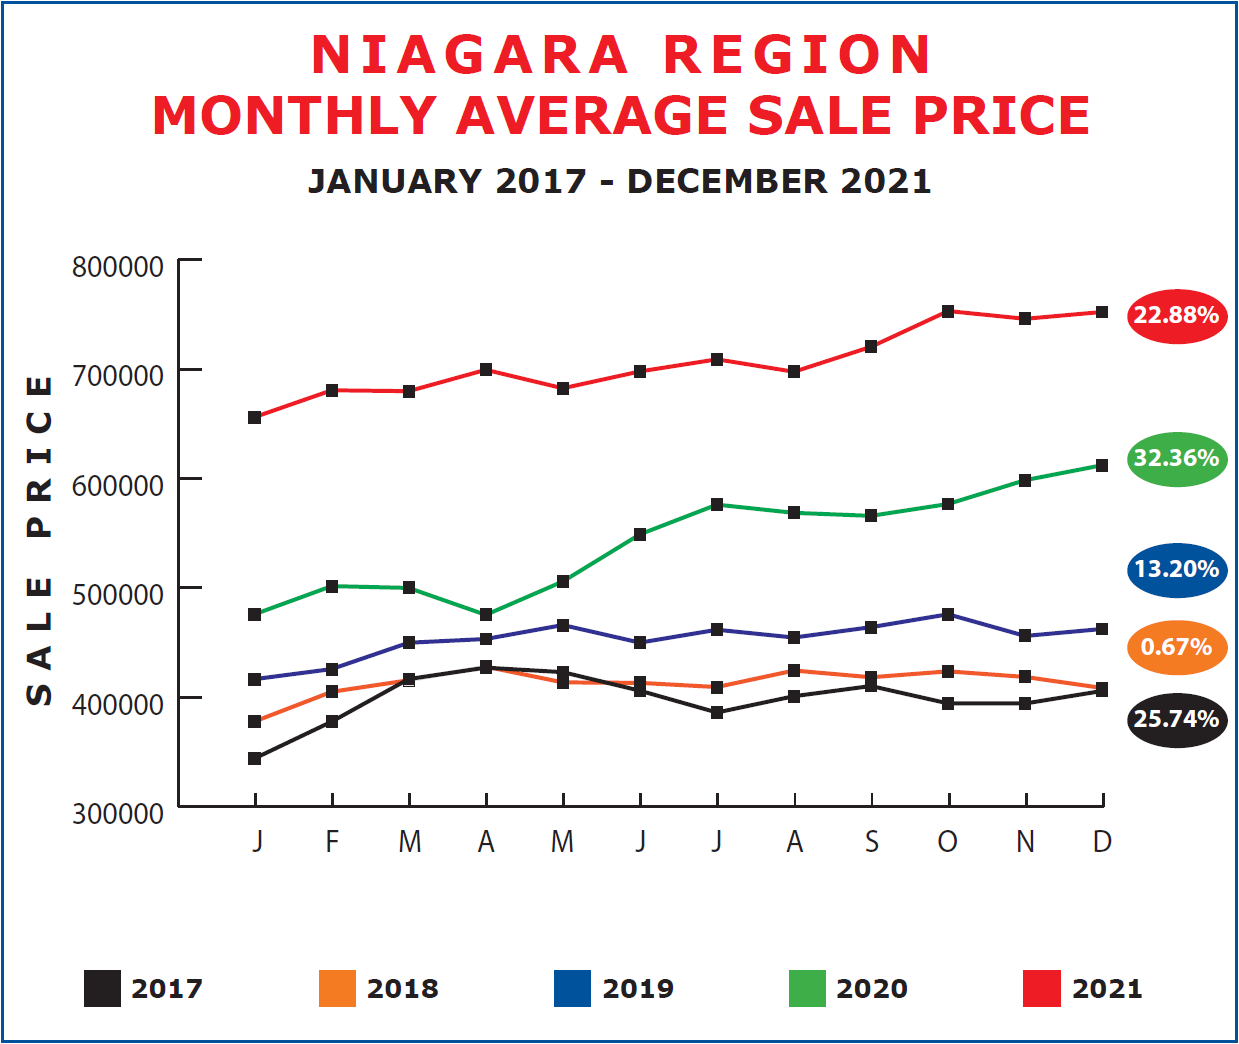
As you can see, 2020 and 2021 have outdistanced previous yearly averages by a substantial margin. 2017 saw those type of gains percentage wise in the first 3 or 4 months of the year until the government stepped in with the foreign buyers spec. tax and the mortgage stress test. This, as you can see, effectively cooled the market gains for the balance of that year and on for the next two. Until the Pandemic.
We won’t take time to look at number of sales recorded in December except to say that they came in very much as expected. Down from November 2021 and down from December 2020, a year ago. But up from December 2017, 2018 or 2019. Falling in pretty much where we would expect.
What I want to share with you, on closing, is an overview of prices across the country over the past 5 years. What happened province by province and city by city. And overall, how we have fared in Niagara. I think it’s fair to say the incredible surge we’ve seen in both activity and price here in Niagara is not something specific to our marketplace. In fact, it’s pretty well a world phenomenon. Across the USA. Over in Europe. Around the globe, people have been rigorous in their pursuit of real estate. And prices have responded accordingly.
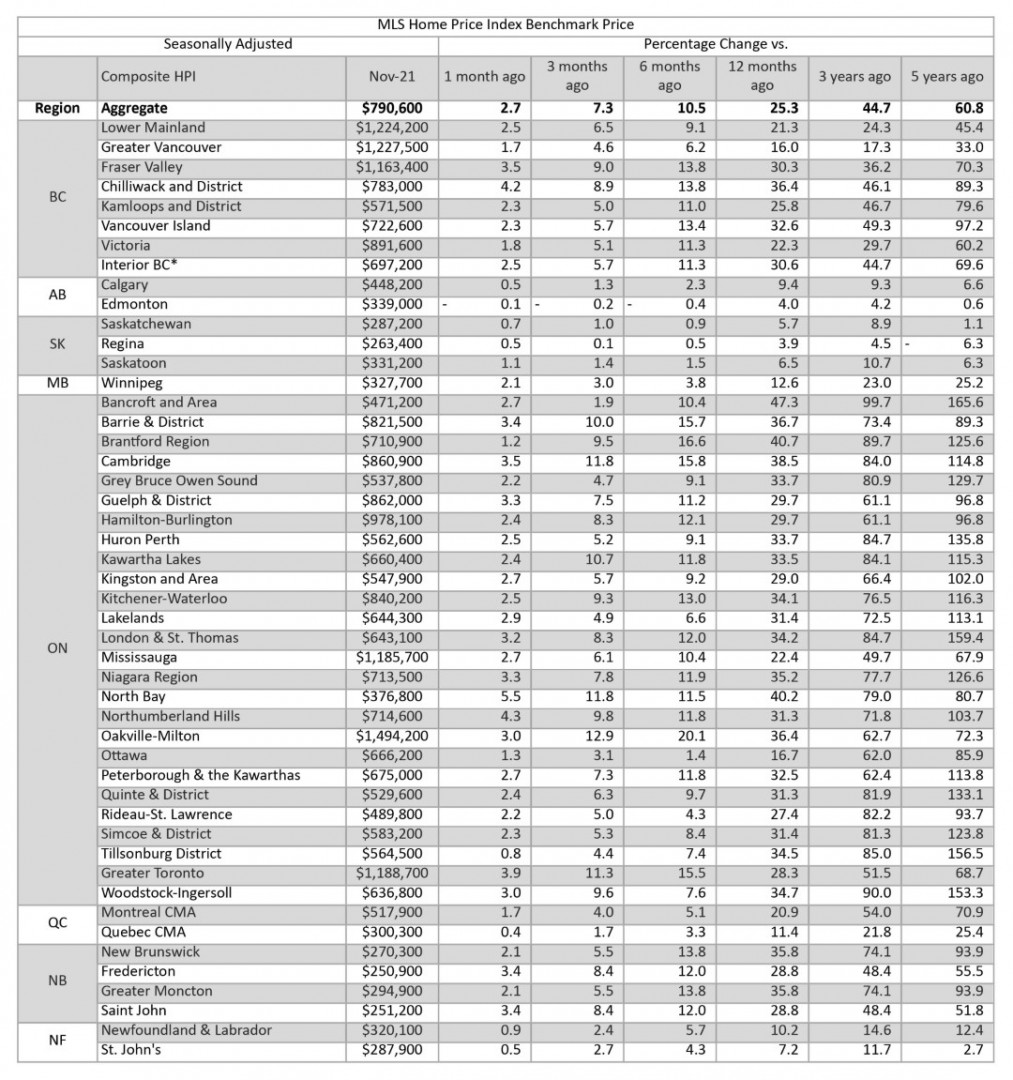
Of course, there are a few pockets here and there that have not seen substantial growth over the past few years. Alberta and Saskatchewan for example. But those are rare exceptions to what has gone on across the country.
Notice Ontario especially. While the entire province has seen substantial growth, notice how the outlying areas of the GTA have gained more ground than Greater Toronto itself. Niagara 126.6% vs Greater Toronto 68.7%. It seems while the larger urban areas will always command the highest price, the gap is closing somewhat. Ease of commute, growing trend for work from home and general affordability no doubt play a part. Note too as travel has been greatly restricted due to Covid, how cottage country has generally enjoyed a substantial increase; Kawartha Lakes 115.3%, Grey Bruce 129.7%, Lakelands 113.1%, Quinte and District 133.1% and so on.
To date, the market has shown little sign of a change. While it is early in the year, already we are seeing multiple offers and rising prices. Barring a Government initiative, we can expect strong demand and substantial price gains again in 2022.