July 15th 2025
There is a trend we have been seeing in the real estate market post-COVID. During the first half of the year, the market builds both in terms of sales activity and also in average sale price. And then it’s like a watershed with the market cresting in around June and then sliding to the end of the year. That’s what happened in 2023, and again in 2024, and that’s what seems to be happening in 2025 based on the first 6 months. Let’s begin with average sale prices.
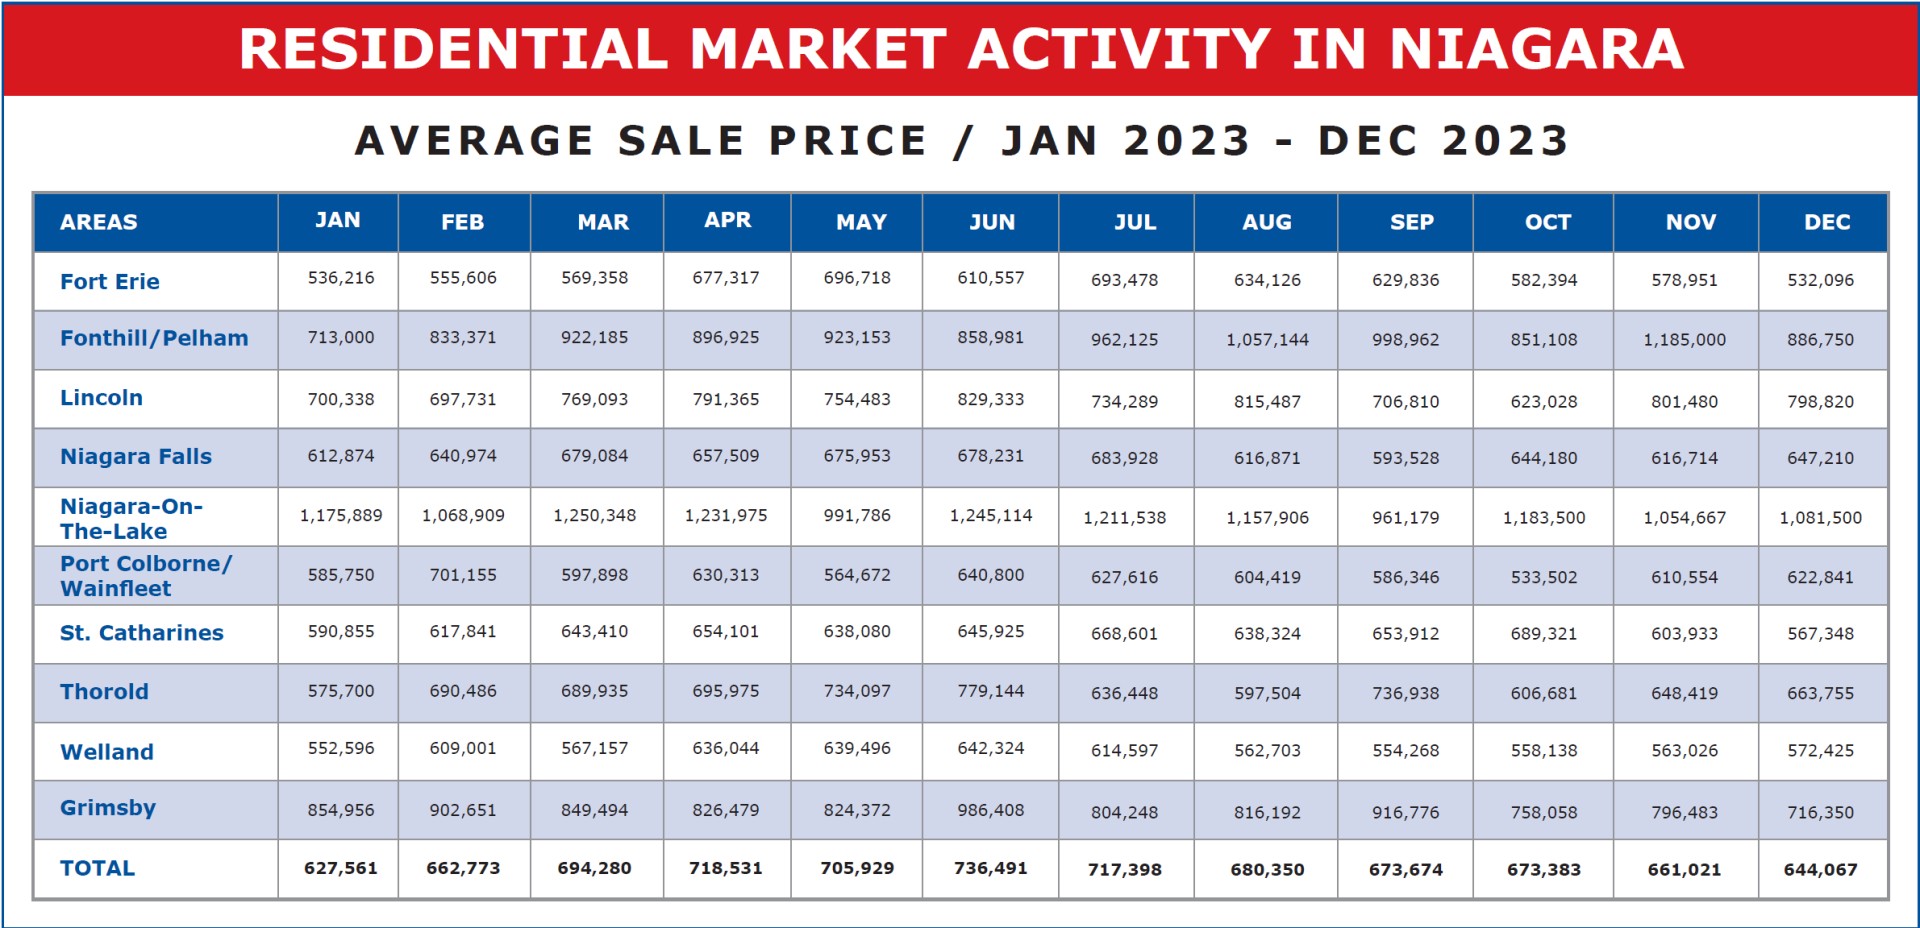
Beginning in 2023, we saw the average sale price across the region move from the $627,561 figure registered in January to $736,491 in June. That’s an increase of $108,930 or 17.36%. We should note too that June 2023 was the high-water mark for prices in 2023.
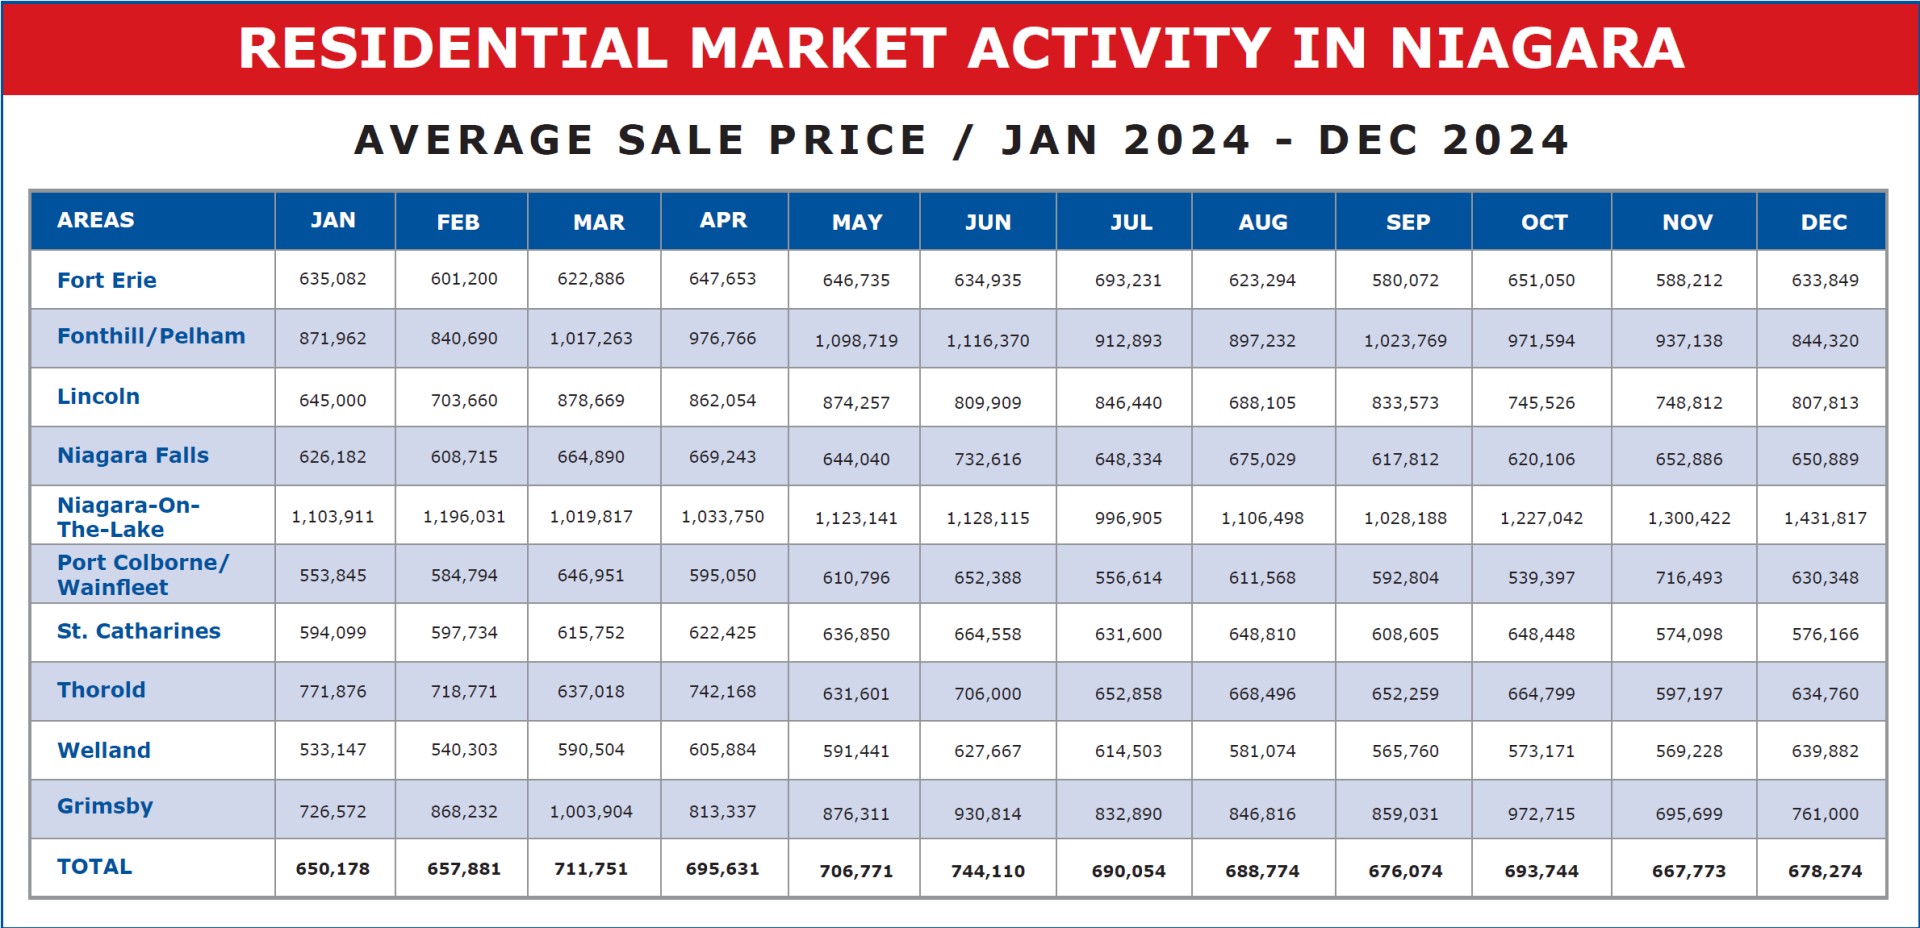
Moving on to 2024, the average sale price came in January at $650,178, slightly higher than the $627,561 registered the year before, but by June the average had climbed to $744,110. An increase of $93,932, slightly more modest than 2023 but still a pretty substantial 14.45%. Here again, June was the month that the prices came in the highest for the year.
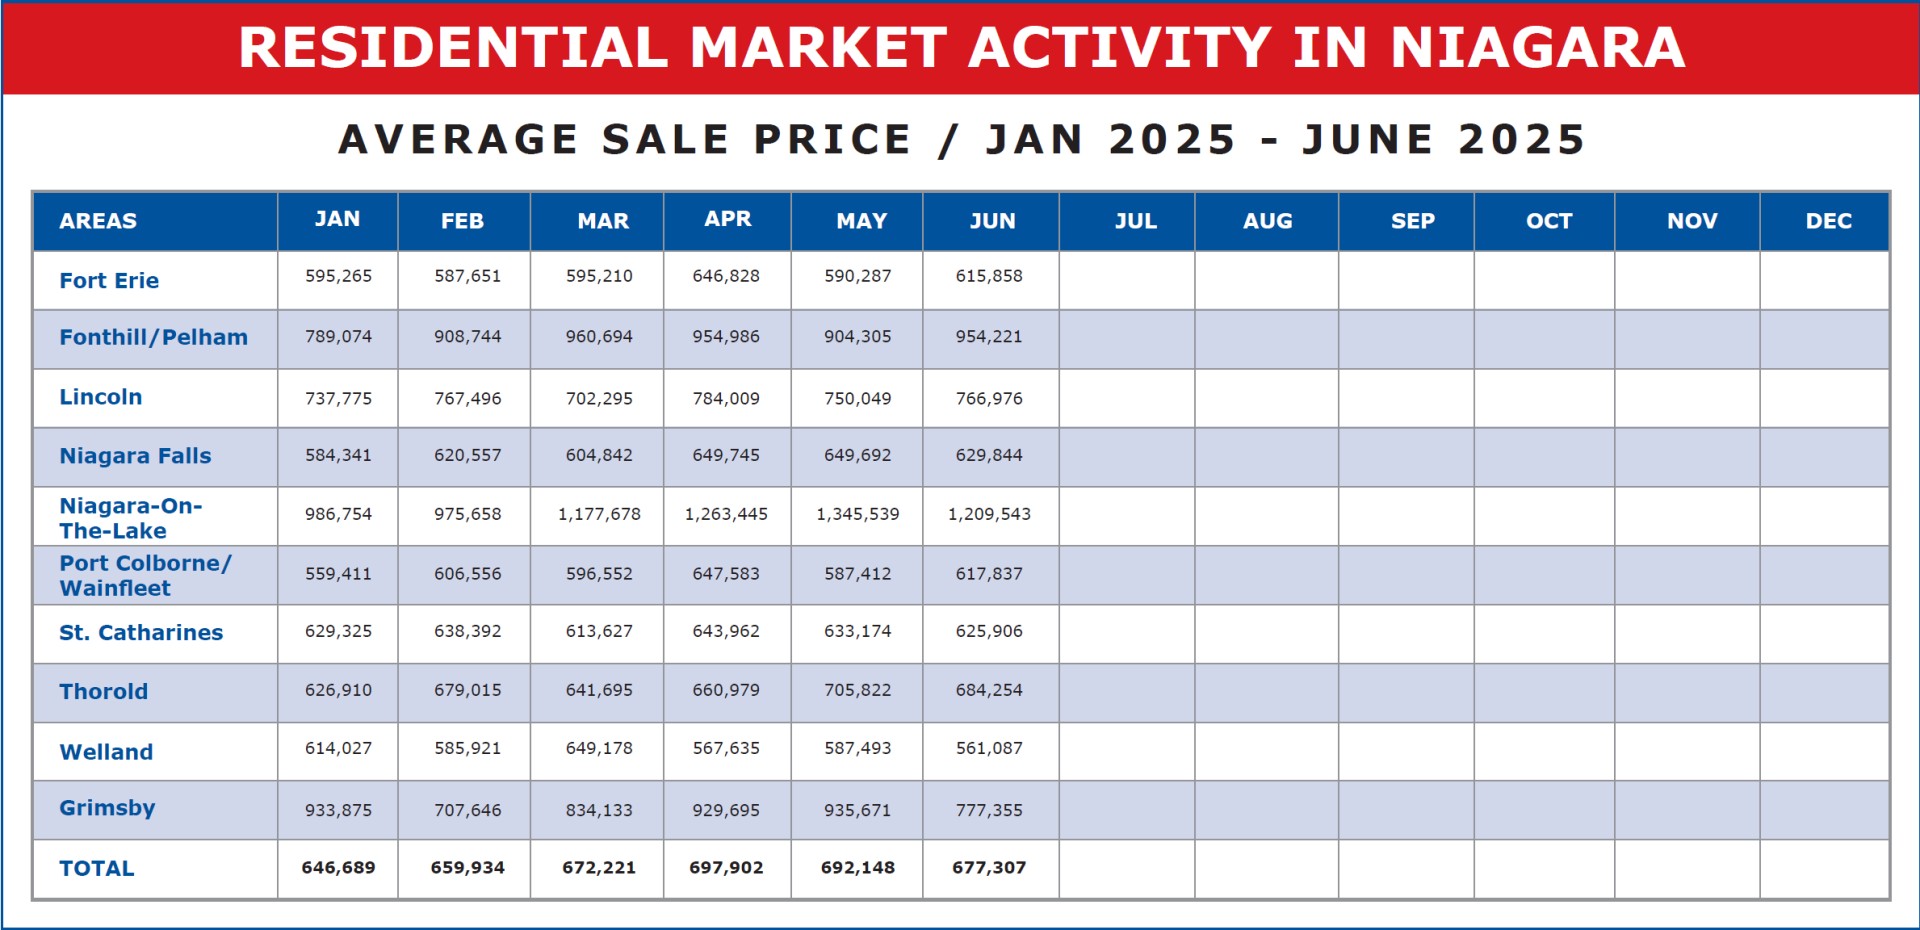
Now on to our current year, 2025. Here the year began with the January sales average coming in at $646,689 and now here in June the average has come in at $677,307. A much more modest increase of $30,618 or 4.73%. Apart from the more moderate lift, one other thing becomes apparent. June is not the top month of the year. April in fact came in at $697,902 which is an increase from January of $51,213 or 7.92%. A little more substantial than June’s figure but still a far cry from the prices registered in the first half of 2023 and 2024.
So, it would appear that 2025 crested earlier than mid-year, after a more modest climb. The last half of the year will tell the tale here.
But here again, let’s look at the losses registered in the last half of 2023 and 2024 and see if they point to any trend we can anticipate for 2025. In 2023 the average price of $736,491 in June slid to $644,067 by year end that’s a drop of $92,424 ending the year $16,506 higher than it started out in January. On to 2024. Here we see the average price of $744,110 in June slide down month after month to end the year at $678,274, a drop of $65,836 and ending the year $28,095 higher than it began in January. The alarming thing however is that the number the year ended at in 2024 is actually $967 higher than where we are today, June 2025. A time that would normally be the high point of the year.
In summary, when it comes to the prices, we see that the acceleration/deceleration has moderated each year since 2023. The gains are not as high and the losses are not as steep. But overall, the gradual gains of 2023 and 2024 are not apparent in 2025. The market so far is softer this year.
Now what about activity? What’s going on there? Interestingly enough, both 2023 and 2024 followed the pattern one would expect, with the activity building in the spring and falling late in the year.
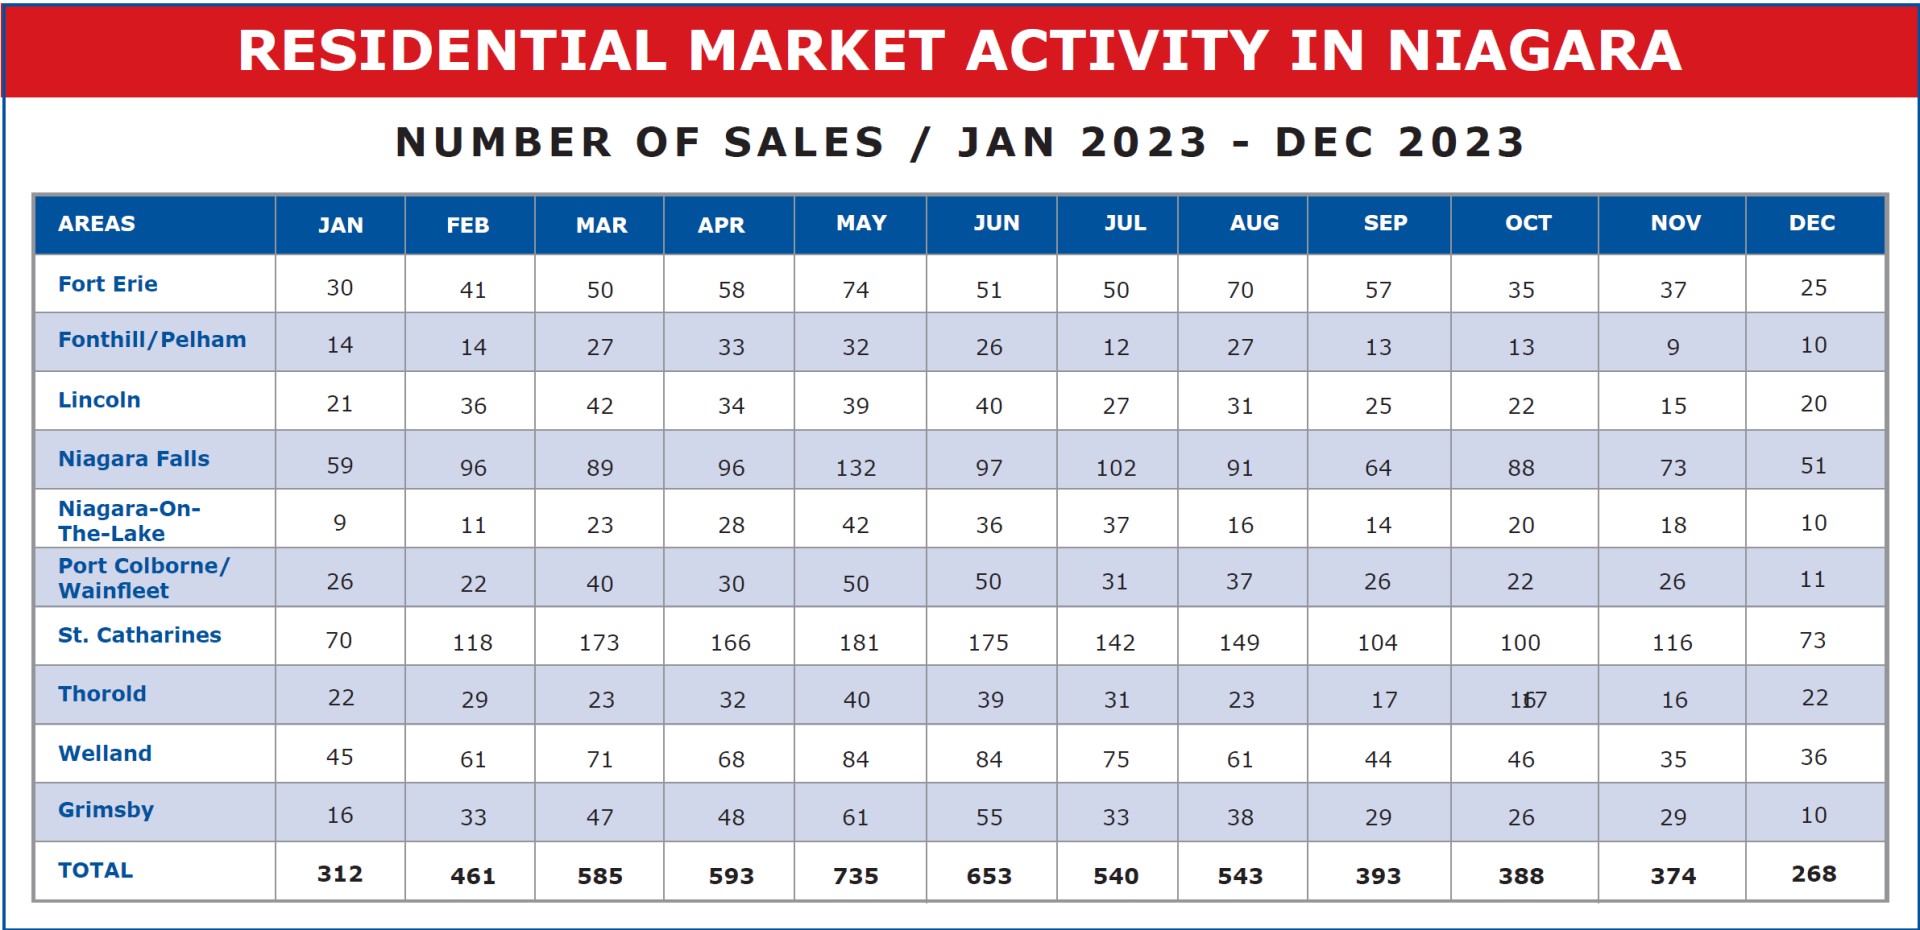
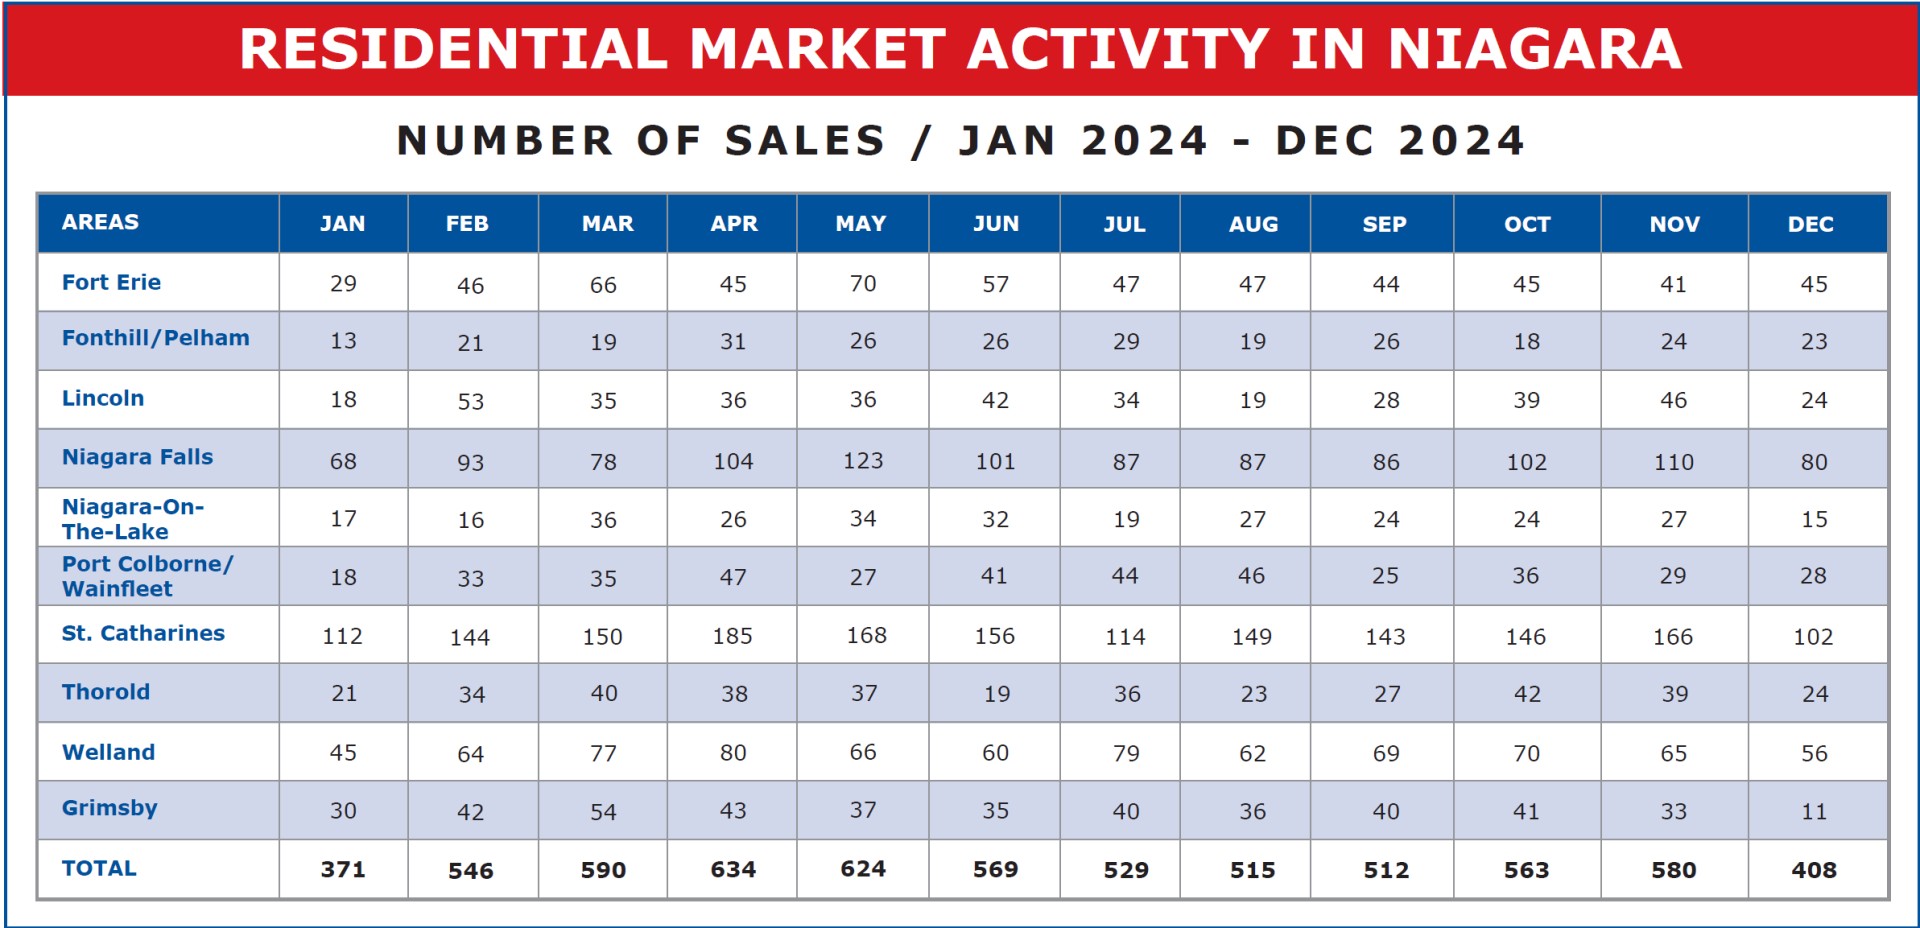
And although the actual numbers do not track exactly from month to month, we see in 2023 a total of 3,339 units change hands in the first half of the year, compared to 3,334 in the first 6 months of 2024, almost exactly the same.
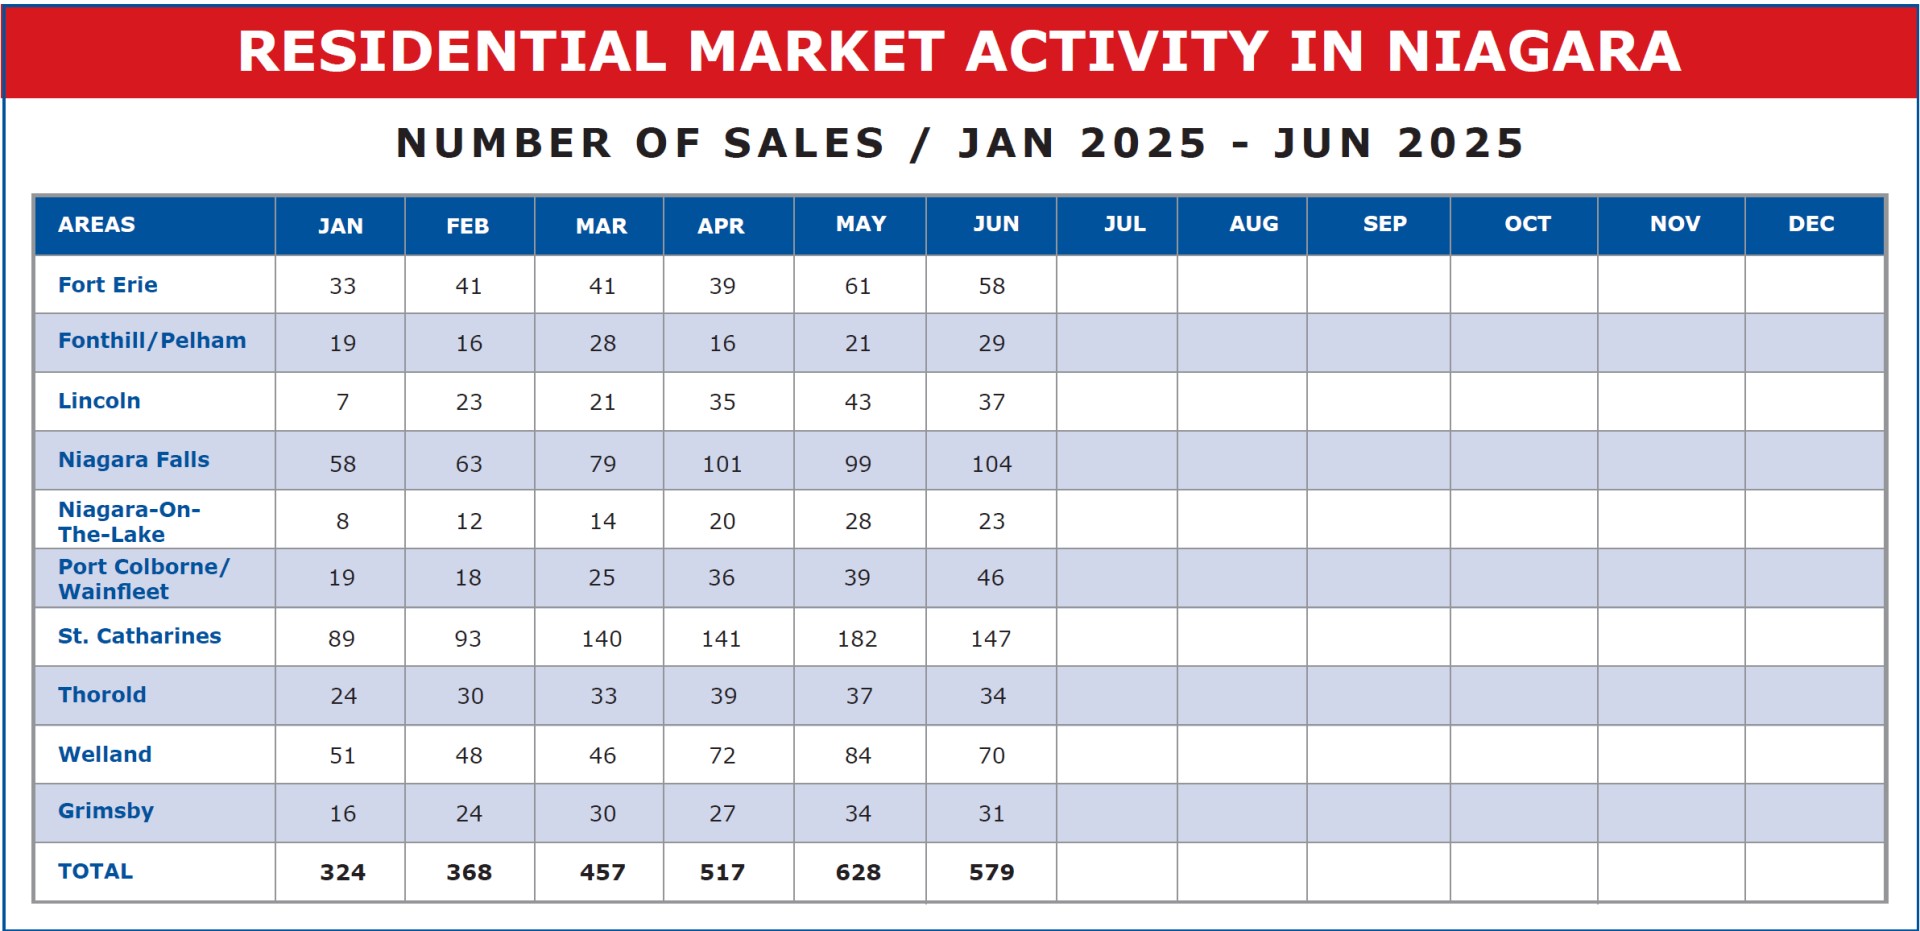
And now on to 2025. Here we see two interesting trends. The first is that in the first 6 months of 2025 a total of only 2,873 units sold. That’s a decrease of almost 14% from either 2023 or 2024. On the other hand, the two strongest months of the year so far for registered sales have been May and June: with each of those months coming in higher than the corresponding two months of 2024. It would seem, in spite of the message that prices are giving us, that the market is actually strengthening as we move into mid-2025. It will be extremely interesting to watch the numbers as they come in over the coming months.