June 15th 2022
 In life, I’m a lot of things. I’m a real estate salesman. I’m a Broker of Record. I’m a teacher. I’m an investor and an investment coach. But by formal training, I’m a mathematician. I have an honours degree in Mathematics from the University of Waterloo majoring in Combinatorics and Optimization. Statistical analysis. I sort of know my way around numbers and they speak to me. But the message derived is only as good as the data from which we draw. Each month the local Board provides us with statistical data to analyze. Two, in particular, we tend to focus on. The number of units sold, and the average sale price across the Niagara Region. In this article, I’ll provide you with an up-to-date snapshot of both. And let’s begin with unit sales. There is absolutely no question the volume of sales is significantly down. Down from last month and down from last year.
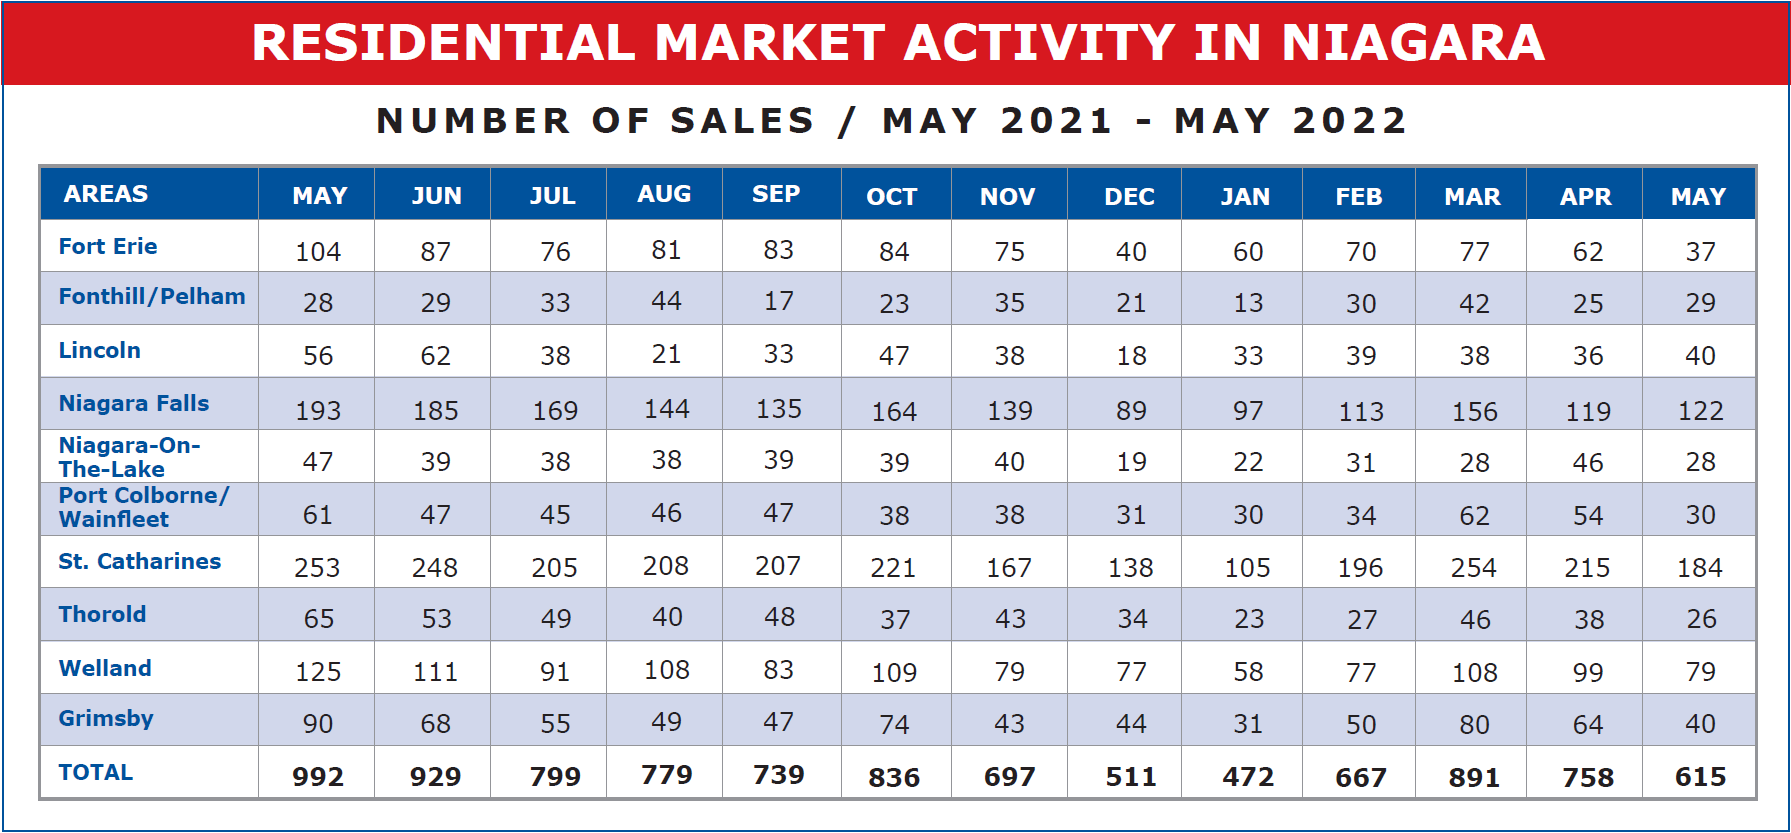
It’s estimated that between 25% and 40% of the market over the past few years has been made up of speculators. When they are no longer at play it leaves a huge hole. And that’s what we are seeing. May registered 615 units sold across Niagara, down 143 units or 18.87% from April and 377 units or 38.0% from last May. All the other segments of the marketplace are still active. In fact, it’s a great time for end-users: first-time buyers, move up or scale down, lifestyle change, relocation. It’s great. Selection is much better than it was a year ago, and sellers are once again open to conditional offers. It’s great for investors. But not for speculators.
And to understand their impact on the marketplace we need to understand their buying habits. For the most part, speculators were not buying upper-end properties. Consequently, properties of $1,000,000 and more are not seeing a lot fewer buyers. But homes from starter to say $850,000 - $900,000 are feeling the impact. Where once there were 15-20 competing offers now there are not. Sometimes none.
And if Mrs. McGillicutty for example, wants to sell her house and do it quickly, she lowers the price to more than compete with her neighbour. Hence the downward slide.
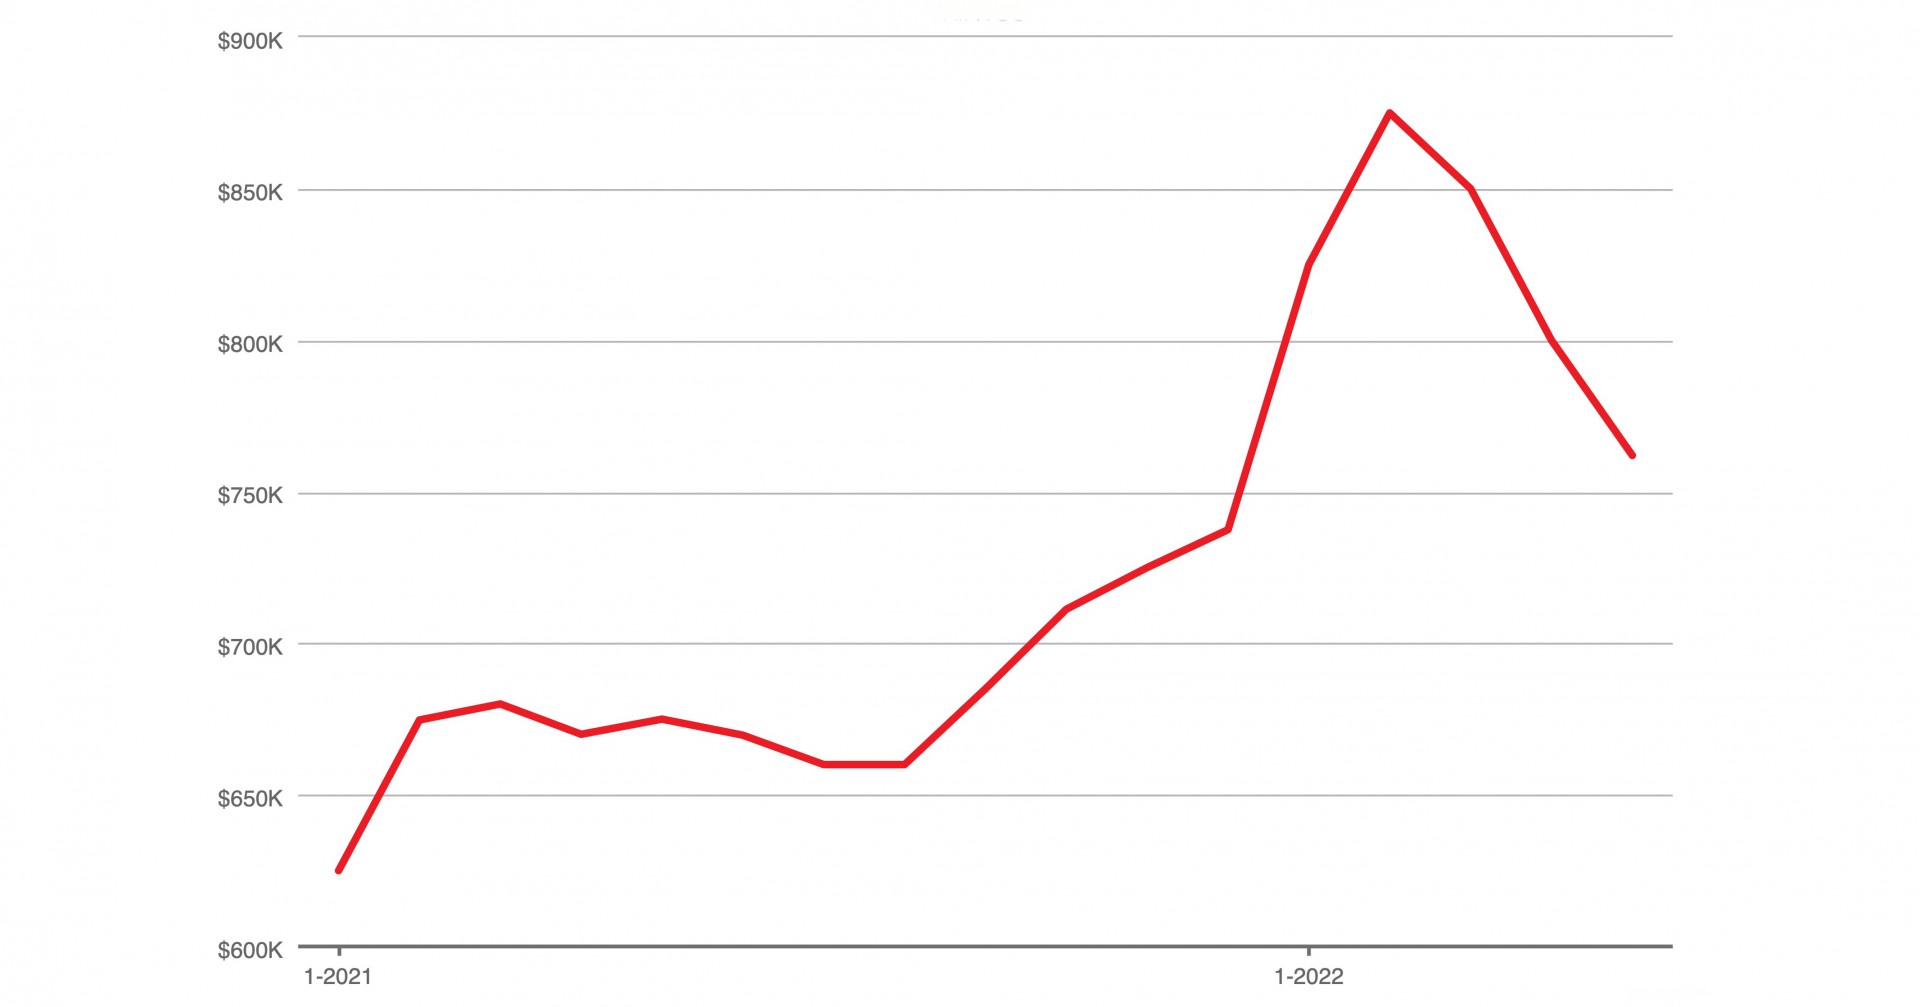
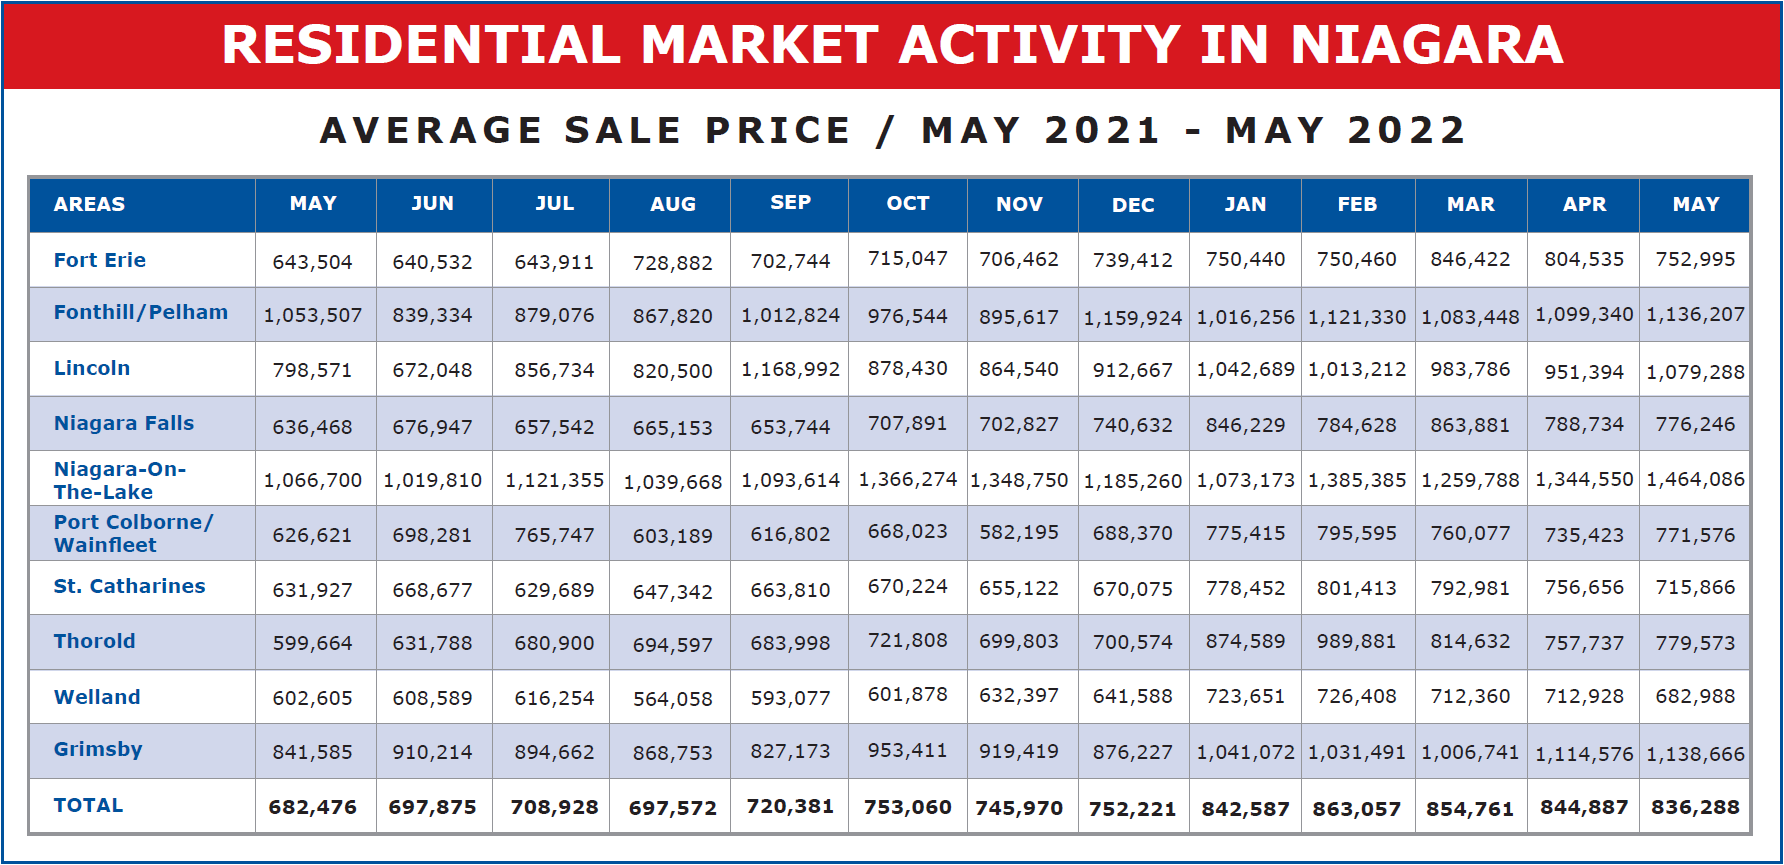
So how much have prices slid? Well, here’s where I have a bit of a problem with the statistical data. According to Board sales figures, the average sale price in our Niagara Region came in at $836,288 in May, down $8,599 or 1.02% from April, which in turn came in at $9,874 or 1.16% from March. That’s still up $84,067 or 11.18% from year-end 2021 and $153,812 or 22.54% from one year ago.