March 14th 2021
Well, it’s been exactly one year now that we have been living under the cloud of COVID-19. What kind of a year has it been? Early in the year with the shadow of a pandemic on the horizon the Canada Mortgage and Housing Corporation (CMHC) predicted a dismal year ahead for real estate in Canada with sales drastically reduced and prices dropping by 10% - 15%. I am happy to report that they were wrong!

We started the year, in January 2020 with the average sale price across the region coming in at $475,958. St. Catharines at $446,826 and Niagara Falls at $429,757. Price gains were recorded through February and March. Then the Pandemic hit, sanctions were put in place and people were strongly encouraged to stay home. As a result, sales activity across the region dropped in April by over 50% down to 280 units from the 567 recorded in March. But prices remained relatively steady. Regionally April came in at $475,385 down $24,615 from the $500,000 recorded in March, a drop of 4.9%. But prices rebounded quickly, and in May the regional average sale price was back up over $500,000 ($505,890). And it just kept on going.
.png)
Sales data provided by the Realtors Association of Hamilton Burlington as submitted through Brokerage members inputted MLS sales.
By the year-end, the average sale price in the Region had soared to $612,162. St. Catharines $557,254 and Niagara Falls $585,606. Those are gains of 26.82%, 24.71%, and 36.28% respectively. A remarkable price surge in just one year, and with the pall of a pandemic. It’s a tribute to just how strong demand is for real estate in Ontario, the Golden Horseshoe, and Niagara in particular.
But look at what is happening in the early stages of 2021. The momentum of price increases is not only continuing, it is accelerating! From the record average sale price across the Region in December of $612,162, by January that had increased to $656,138, an increase in just one month of 7.18%, and in February it reached $680,621 an increase of 3.73% from February to March and an overall increase in the first two months of the year of $68,459 or 11.18%. That’s in just two months.
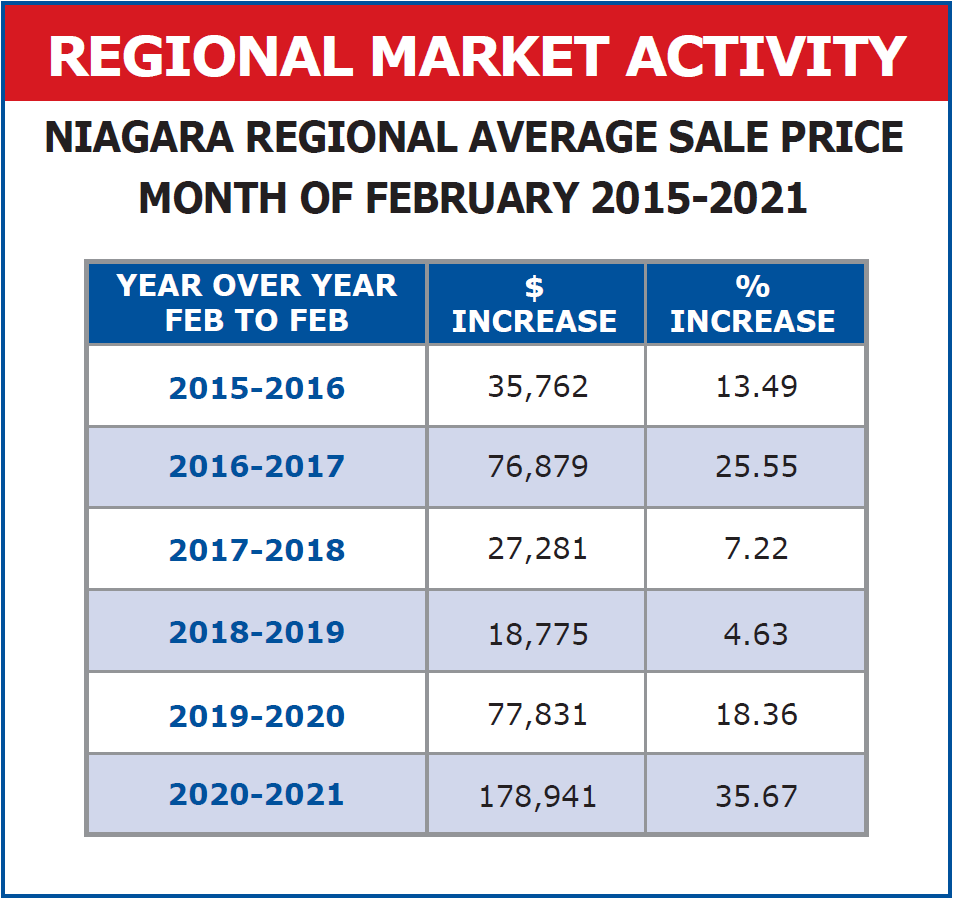
To really understand the incredible rise in prices across the region, let's look at how average prices have increased year-over-year since 2015 tracking averages each February.
.png)
Sales data provided by the Realtors Association of Hamilton Burlington as submitted through Brokerage members inputted MLS sales.
Analyzing the year-over-year increases, we see a steady price increase and acceleration from 2015 to 2017, then a slight flattening from 2017 to 2019 due to the government introduced stress test for mortgages and the foreign buyer's speculation tax. Since the end of 2018 the market has really increased in intensity with prices not only continuing to swell but at an ever-accelerating pace.
Sales data provided by the Realtors Association of Hamilton Burlington as submitted through Brokerage members inputted MLS sales.
And because of the fact that as these figures each year build on the previous, the effective increase in market value from February 2015 to Feb 2021 is an astounding 156.69% region-wide.
If this trend continues, and at this point, there is no reason why it shouldn’t, it’ll shape up to be a very interesting year indeed.