March 15th 2022
Back in the early fall of 2021 after an incredible run-up in prices over the first 8 or 9 months of the year, the average sale price for St. Catharines sat at $663,810 (end of September). We couldn’t help but wonder if after gaining $106,556 or 19.12% from the beginning of the year if the average price could possibly cross the $700,000 threshold by year-end. It didn’t. The average price in St. Catharines ended the year 2021 at $670,075. Still a yearly increase of 20.25% but not quite $700,000. Who would have thought that just 2 months later, in February 2022 the average price in St. Catharines would have crossed not only the $700,000 mark but the $800,000 as well, ending at $801,413?
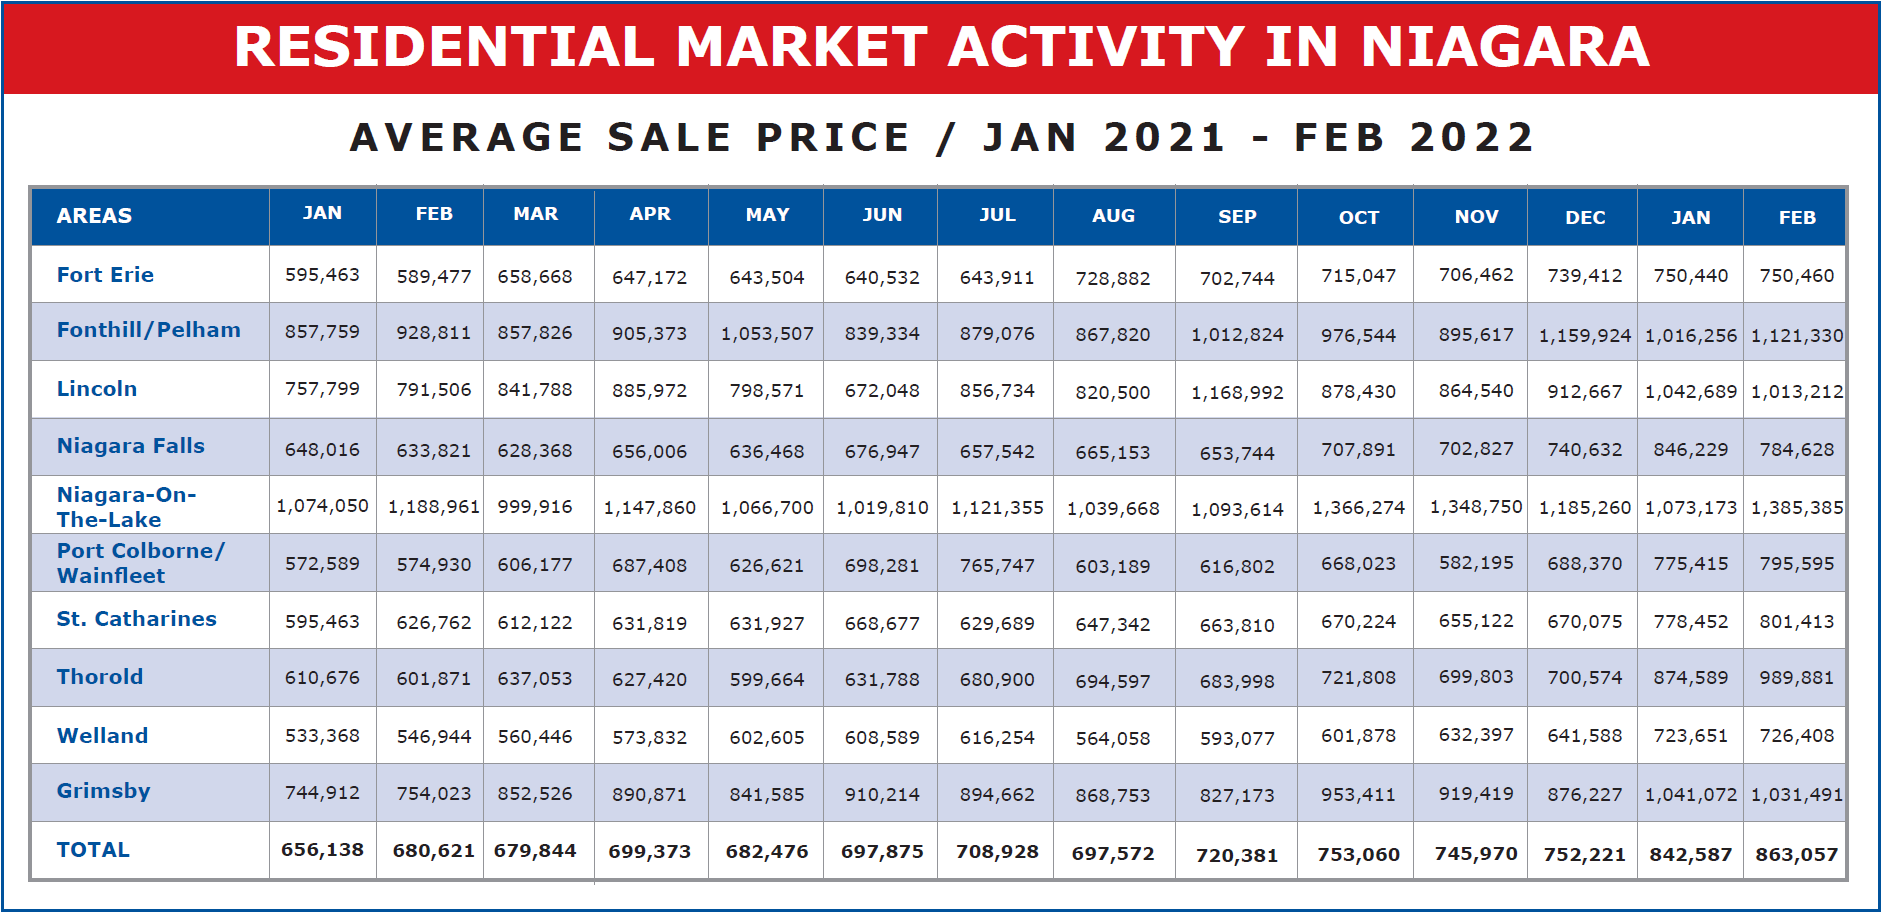
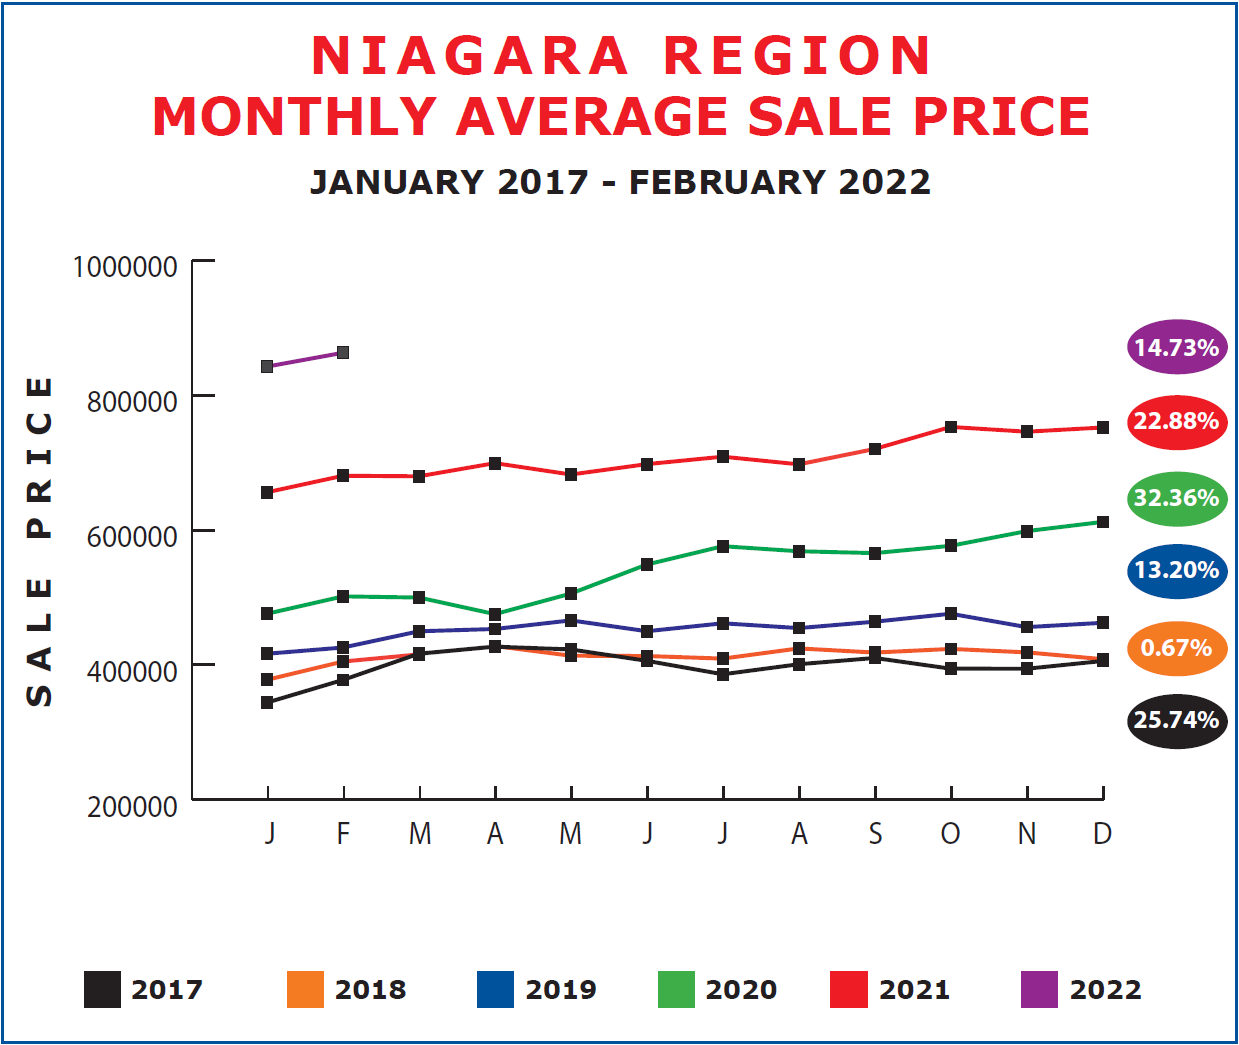
That’s a price increase of $131,338 or 19.6% in the first two months of this year. And while the Region as a whole didn’t fare quite as well, it still registered an average increase from $752,221 to $863,057 or 14.73%. That two-month increase is actually higher than experts were forecasting for the entire year. Of course, as we’ve seen often, most of the increases registered in any given year occur in the first half. But still, it’s still early and there is a lot of growth potential awaiting us through the spring market.
One other factor that needs to be considered if we hope to analyze the complete picture of what is going on in the real estate market in Niagara has to do with inventory. Measuring inventory involves two factors. New listings coming on the market and existing listings being sold. As we’ve seen in previous studies of the market, available inventory across the country stands at an all-time low, under two months while here in the Golden Horseshoe most areas are sitting with available inventory of less than one month. That should be easing somewhat as we move into spring. January saw a total of 529 new listings come in, compared to 616 the previous year. But at the same time, units sold decreased to 472 from the 530 registered in 2021. February saw a stronger increase in listings actually exceeding last year with a total of 864 new listings coming in, an increase of 40 from last years 824. At the same time unit sales in February came in at 667 properties, down 92 units or 12.12% from a year ago.
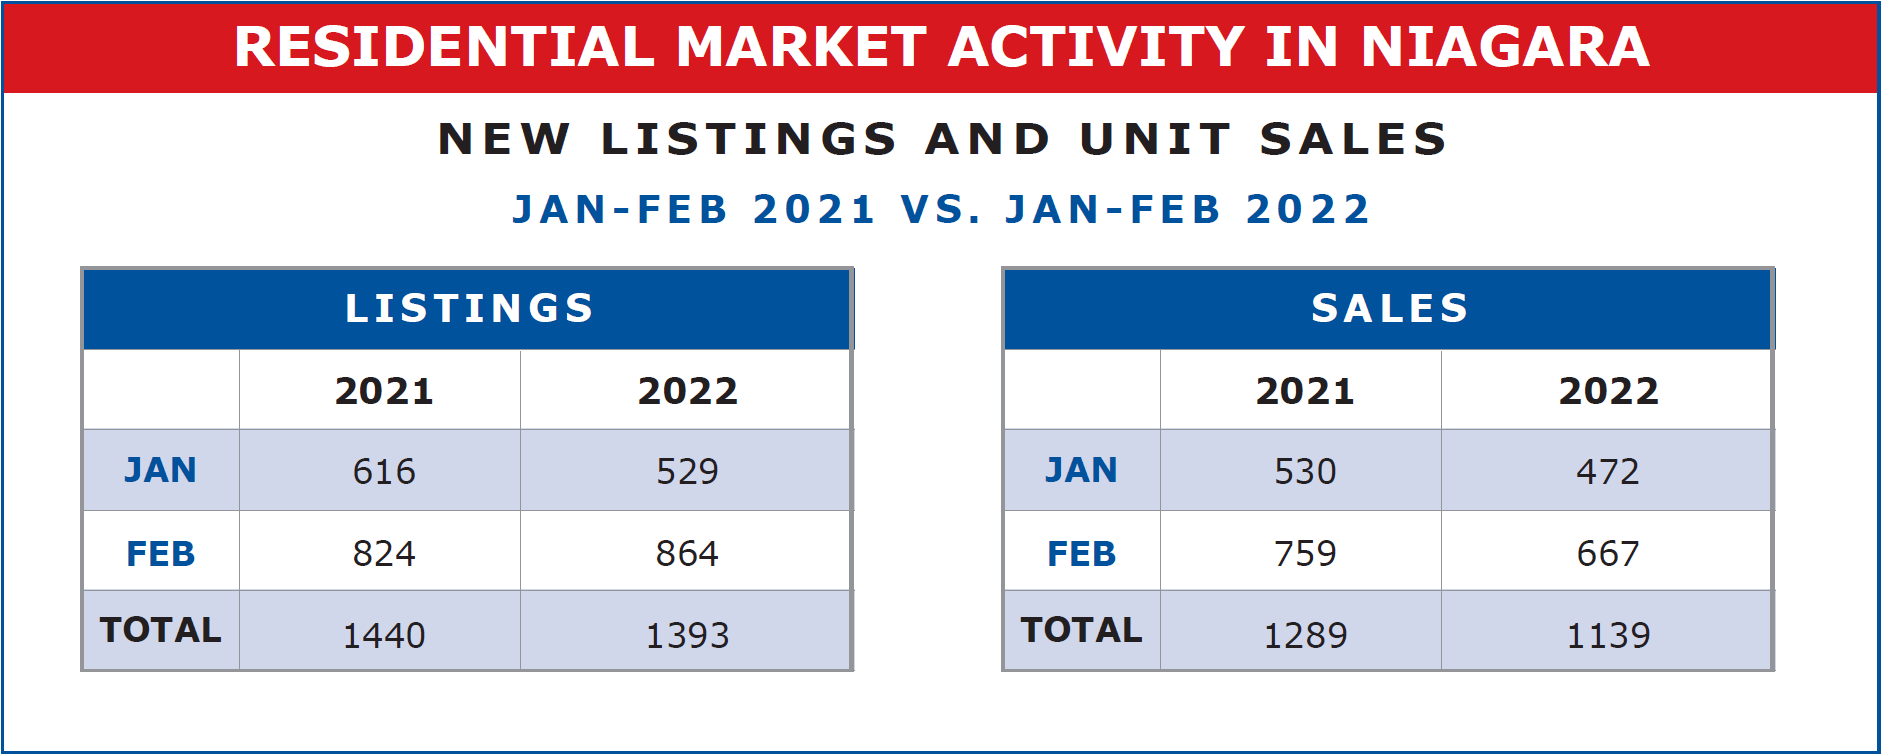
So, as you can see, listings, while still lagging behind last year, are gaining ground while at the same time sales in the first two months of 2022 are well below the pace registered in 2021. (-11.6%)
If this trend continues into the Spring we can expect the shortage of inventory to ease up, months of available inventory to increase, and correspondingly less upward pressure on prices.