March 15th 2023
Last month as you may recall we saw a significant drop in average sale price across the region compared to those recorded in December, down – 4.38% or $28,776. At the same time, however, we sensed a feeling of optimism in the marketplace. People remain very much interested in real estate. They want to get back in the game. Speaking to an agent the other day she told me she had just come from hosting two open houses and in each, she had more attendees than any open house she put on in 2022. The market has been volatile. Interest rates are formidable. But the desire for home ownership and real estate acquisition is very much alive.
So, what’s happening with prices in February? Well, as you’ll see from the chart below, the average sale price across the region came in at $662,773 in February, up $35,212 or 5.6% from January, not only erasing the losses suffered in January but actually coming in above the $656,337 figure we ended the year 2022 at.
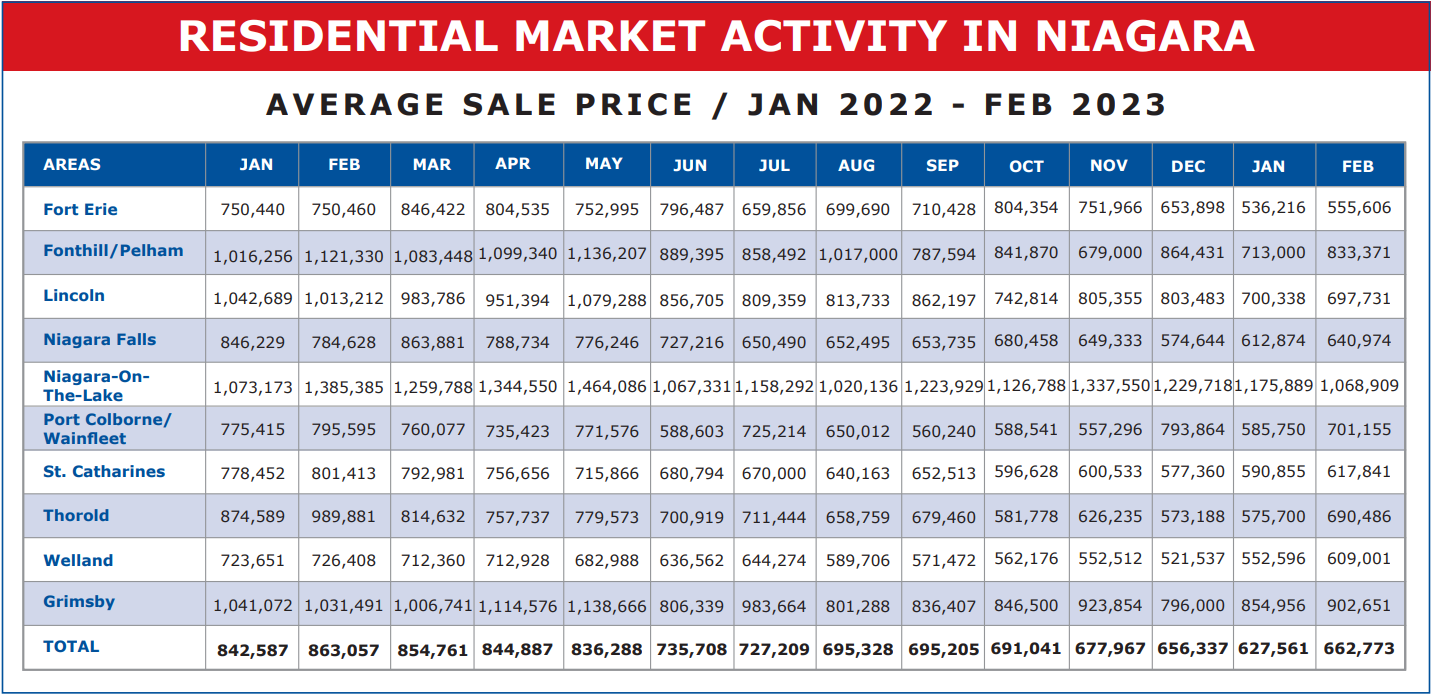
There is still some discrepancy from municipality to municipality. Attributed both to the fact that some areas are quite small and offer a very limited number of sales to compute from and also to the fact that volatility still exists in the marketplace. But of the 10 municipalities we track here in Niagara, 8 registered month-over-month increases. We’re still not at the $695,000 level we plateaued at back in Aug.-Oct., but not far off.
One year ago, in February 2022 the market was at its all-time peak. The average price in the region came in at $863,057. We’re $200,284 off that mark today. A drop of 23.21%. That’s sizeable in just one year. But the feeling is that the slide may well be over, and putting it into context, we’re up $187,388 or 39.42% from April 2020 when the effects of Covid 19 first impacted the market.
But let’s take a minute and look at overall activity in the market. What are sales volumes like?
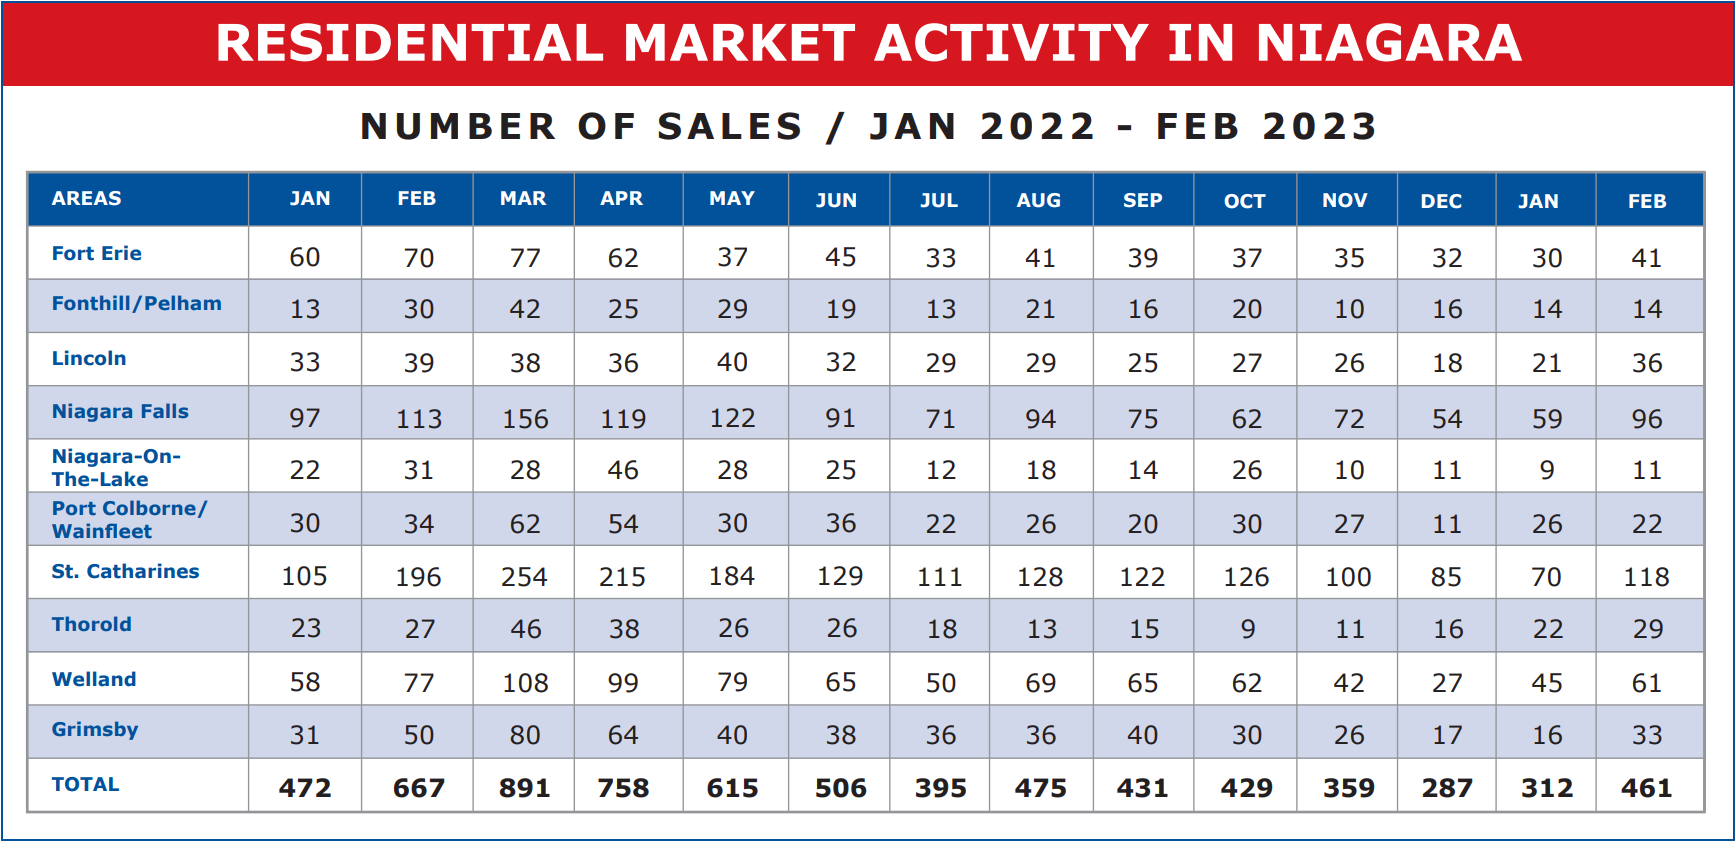
February registered 461 residential sales across the region. And while that’s up considerably from the 312 we saw in January – an increase of 47.8%, that’s expected. That’s seasonal. And all things being equal, we should see another sizeable increase in March as the weather warms and we enter the spring market.
But even at 461 units, the sales volume falls far below what we have experienced recently. Perhaps this can best be illustrated by way of a graph depicting sales volumes in the region over the past 6 years, going back to 2018 before Covid 19 impacted the marketplace.
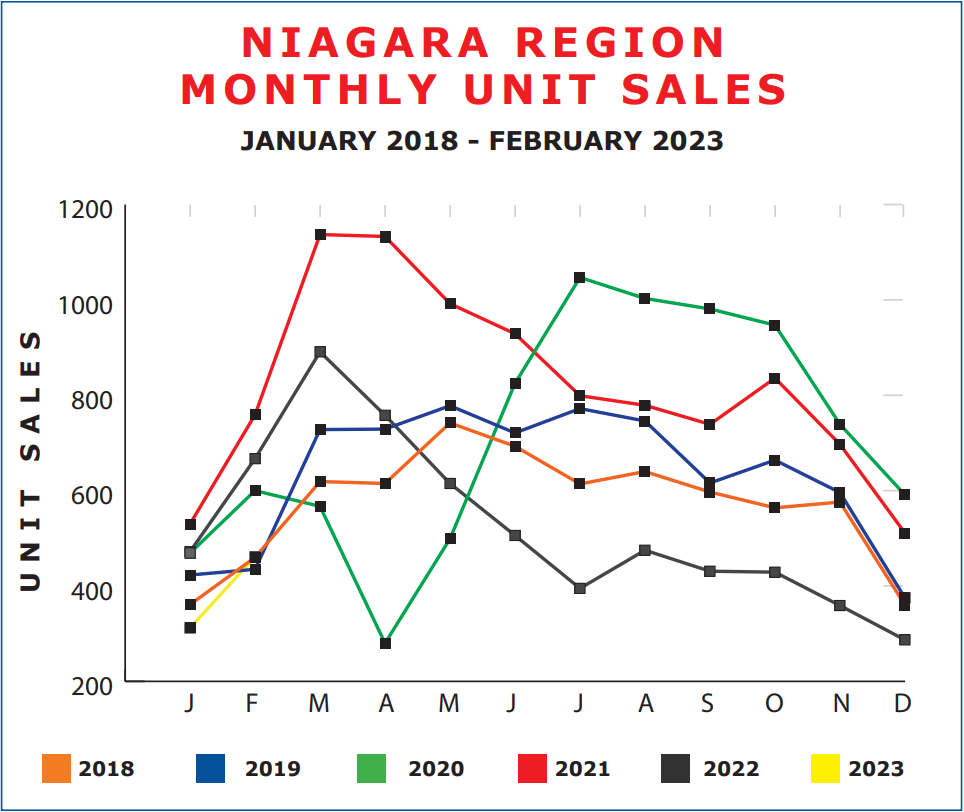
Looking at the graph, starting with the year 2020 you’ll see Jan., Feb. started off pretty normally. But then the trend started to increase in March, and then in April the market pretty much ground to a halt. Covid shut down! But not for long. Look at the activity spike from April to July. Absolutely remarkable. And that activity stayed strong pretty well to year-end. The year 2021 started off gangbusters and continued strong again right to a seasonal slowdown at year-end. But now look at 2022. Very strong activity in the first couple of months, until April when both prices and activity started to slide. And throughout the remainder of the year, new lows were set in unit sales pretty well every month.
But what really is normal? What should we expect? I think realistically we need to look at the years 2018 and 2019. These were pretty normal years. Before the frenzy of home buying and speculation in the face of escalating prices really gripped the marketplace. How do we compare to those norms? Well, it’s very early to tell, with only two months to go by. But as you can see January to February saw a pretty steep incline in activity. Much more drastic in fact than either 2018 or 2019. That’s a good sign. And at this point, February sales in 2023 are exactly on par with 2018 (Feb. 2023 – 461, Feb. 2018 – 460) and actually above 2019 (Feb. 2023 – 461, Feb. 2019 – 435). Normal markets. We need to temporarily put out of our minds the effects of Covid and see how we fare compared to the traditional normal market. And so far we’re doing pretty well. And, as you can see from the registered leaps in sales that March traditionally brings, next month should really tell a story.
Personally, I’m not sure we’ll rebound as quickly as in ‘normal’ years in the early months of 2023, because we’ve still got some volatility to overcome. But on the other hand, we’ve got market enthusiasm and pent-up desire. I don’t think it’s unreasonable to expect not only a rebound in activity as we move into the latter part of the year but a recovery to some extent of prices as well.