October 15th 2020

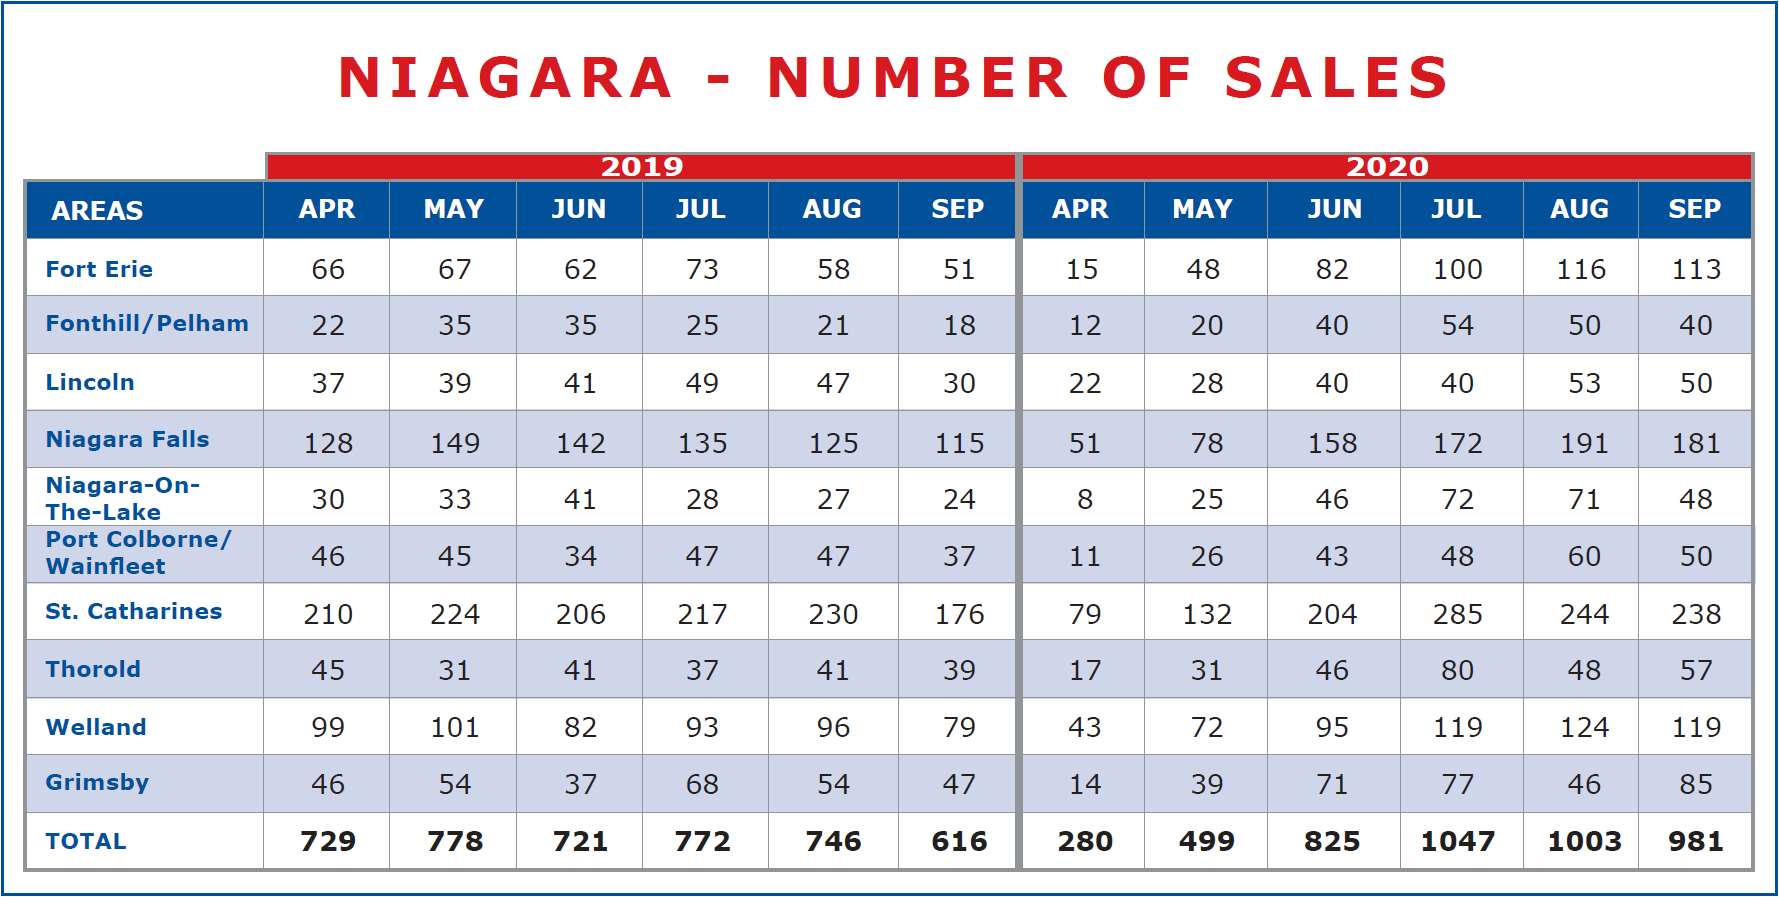
Moving on into the Fall, the market in Niagara continues to show remarkable strength. As one might expect, there is a slight dip in the number of sales recorded in August and September over the late spring and summer figures, but not much. In August, a total of 1003 sales were recorded across the region and in September the numbers had dropped slightly to 981. When compared to the record 1047 set in July, that represents a drop of 4.20% for August and a further drop of 2.19% in September, and that is in keeping with previous trends for this time of year.
*Sales data provided by the Niagara Association of Realtors and the Hamilton-Burlington Realtors Association as submitted through Brokerage Members inputted MLS sales.
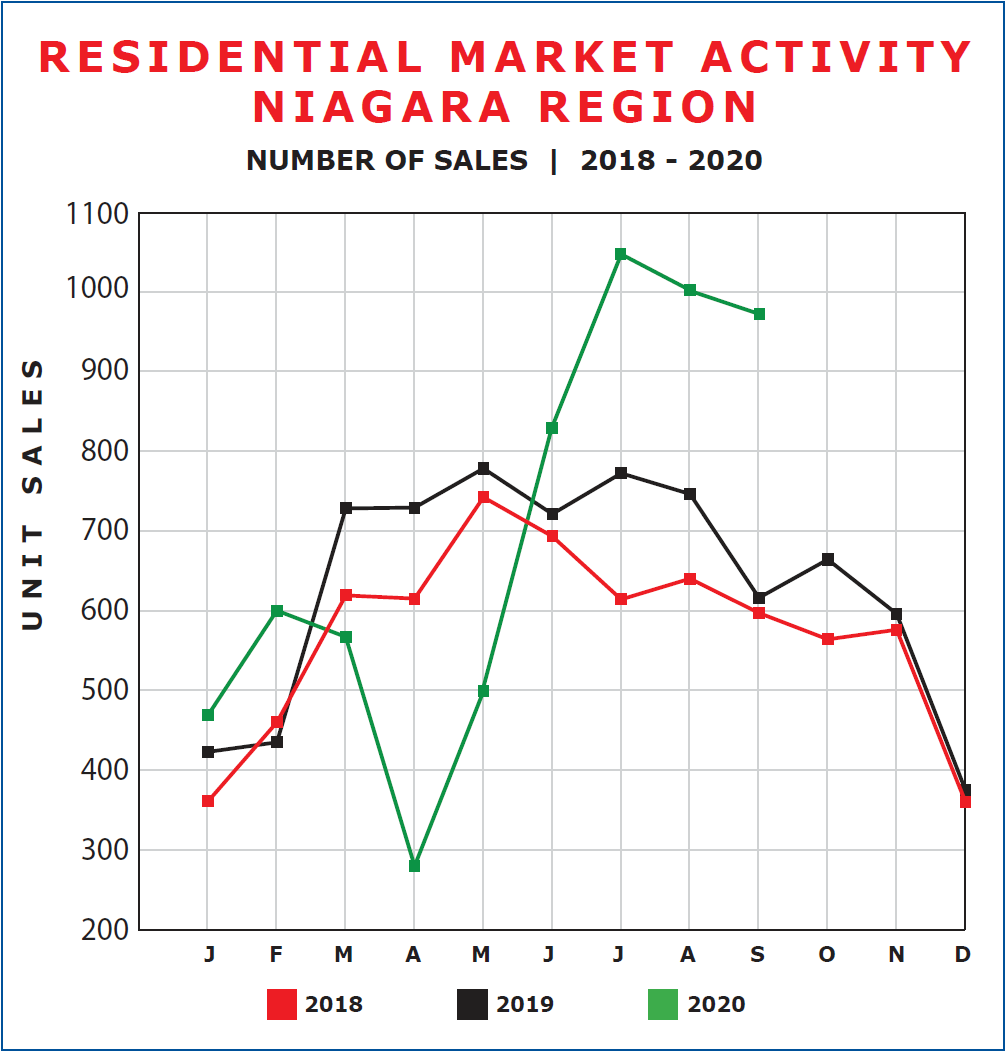
What is remarkable however is the overall strength of these numbers when compared with past years. Looking at August for example. While down slightly from July, if we compare it to the 746 recorded in August 2019, we see that we are up 34.5% and compared to the 640 of August 2018, this year is up 56.7% over that period. And the same holds true for September. In September 2019 a total of 616 sales were recorded. Compared with this year, that’s a year-over-year increase of 59.3%. Going back a year further, we see September 2018 came in at a total sales figure of 597 across the region. Compared with that, this September is up 64.3%. This is not only remarkable, it is uncharted territory. The numbers we are seeing for July, August and September are not only significantly higher than their corresponding months in years past, they are actually higher than any volumes previously recorded. The accompanying chart will help illustrate how significant these number shifts this year are.
*Sales data provided by the Niagara Association of Realtors and the Hamilton-Burlington Realtors Association as submitted through Brokerage Members inputted MLS sales.
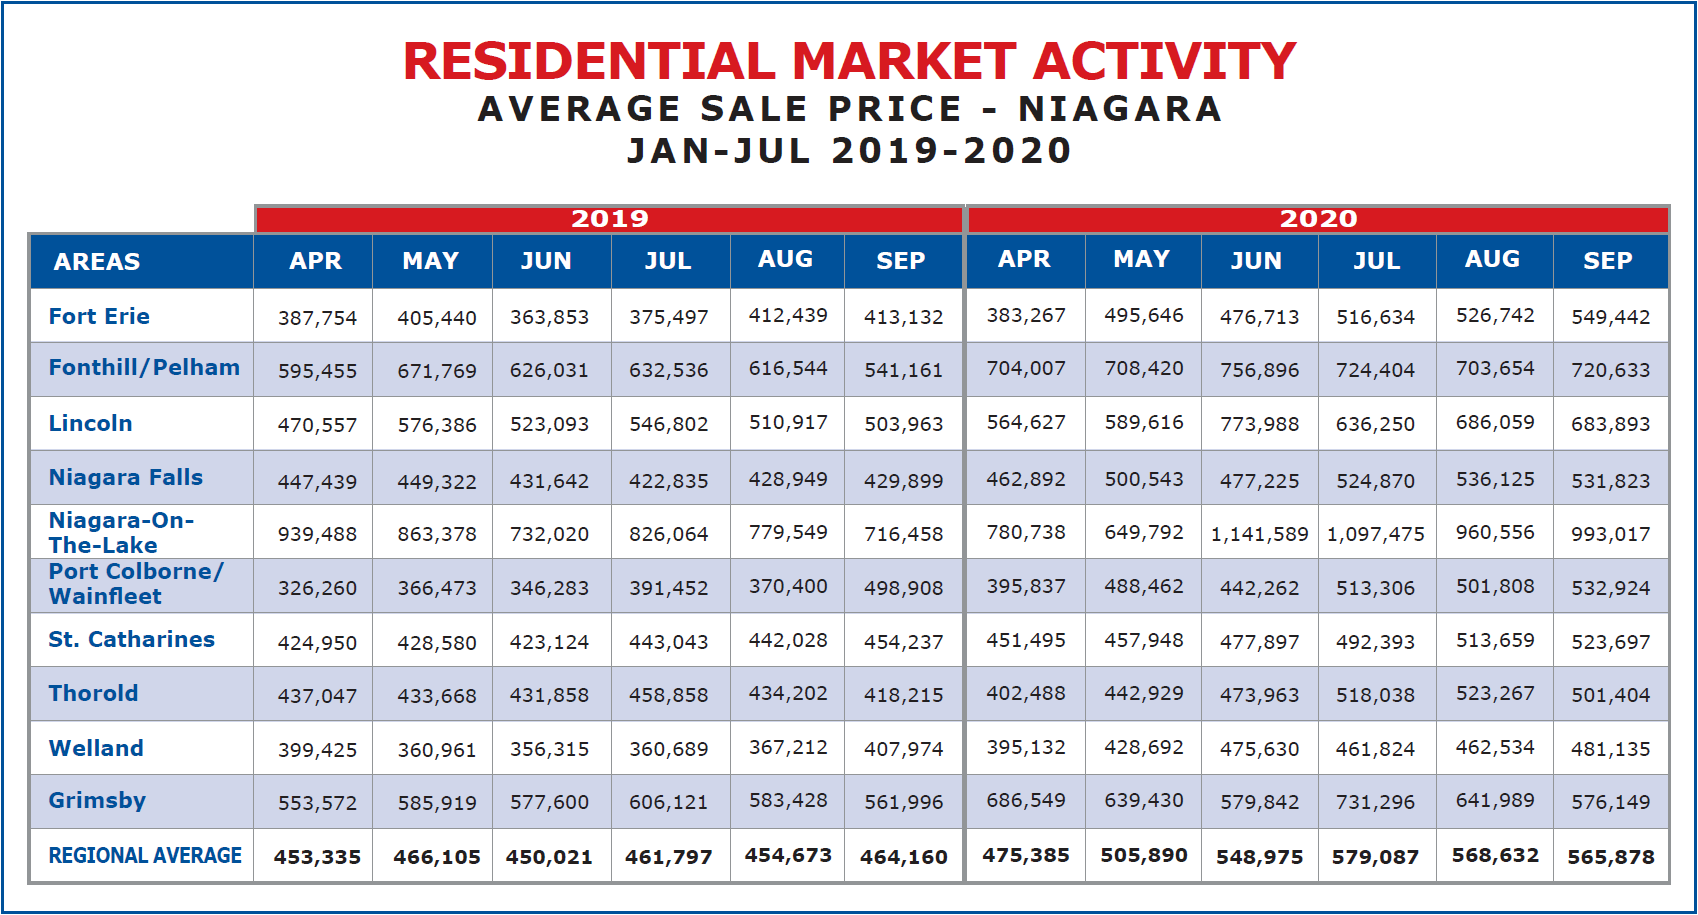
When we move on to price, we see this same pattern emerge. August and September across the region saw a slight levelling of prices with the average price in September registering at $565,787, down $10,252 from July a drop of 1.78% and down $2,754 or a drop of 0.48% from August. Again not really significant enough to create a trend. What is significant however is the year over year price changes. September’s $565,878 is an increase of $101,718 or 21.91% from the $464,160 recorded in September 2019 and in increase of $147,503 or 35.26% from the $418,375 set in September 2018.
*Sales data provided by the Niagara Association of Realtors and the Hamilton-Burlington Realtors Association as submitted through Brokerage Members inputted MLS sales.
What we are noticing in the marketplace is that homes priced slightly below market value and homes at an entry level price point are generating a lot of interest and usually multiple offers. Sale prices of 5% to 10% above asking are not uncommon. At the same time, while homes in every price range are moving well, homes that are overpriced tend to sit on the market attracting little attention and no offers.
So while the market is extremely strong and prices are continuing to climb, buyers are astute. Sellers who are serious can do very well but they need to be attuned to the market and set their prices accordingly.