May 17th 2021
In trying to understand what is going on in the marketplace, there are a number of factors at play: COVID restrictions, price appreciation, available inventory or lack thereof, interest rates, and a whole lot more. And in trying to measure the change that is occurring and make projections going forward, there are certain key indicators that are helpful to follow; price change month over month and year over year. Number of new listings coming into the marketplace. The total number of sales. Months of inventory available, etc.
Of course, we can’t analyze all of the available data within this limited article space, but there are three very key indicators that we touched on last month and we need to revisit again now.
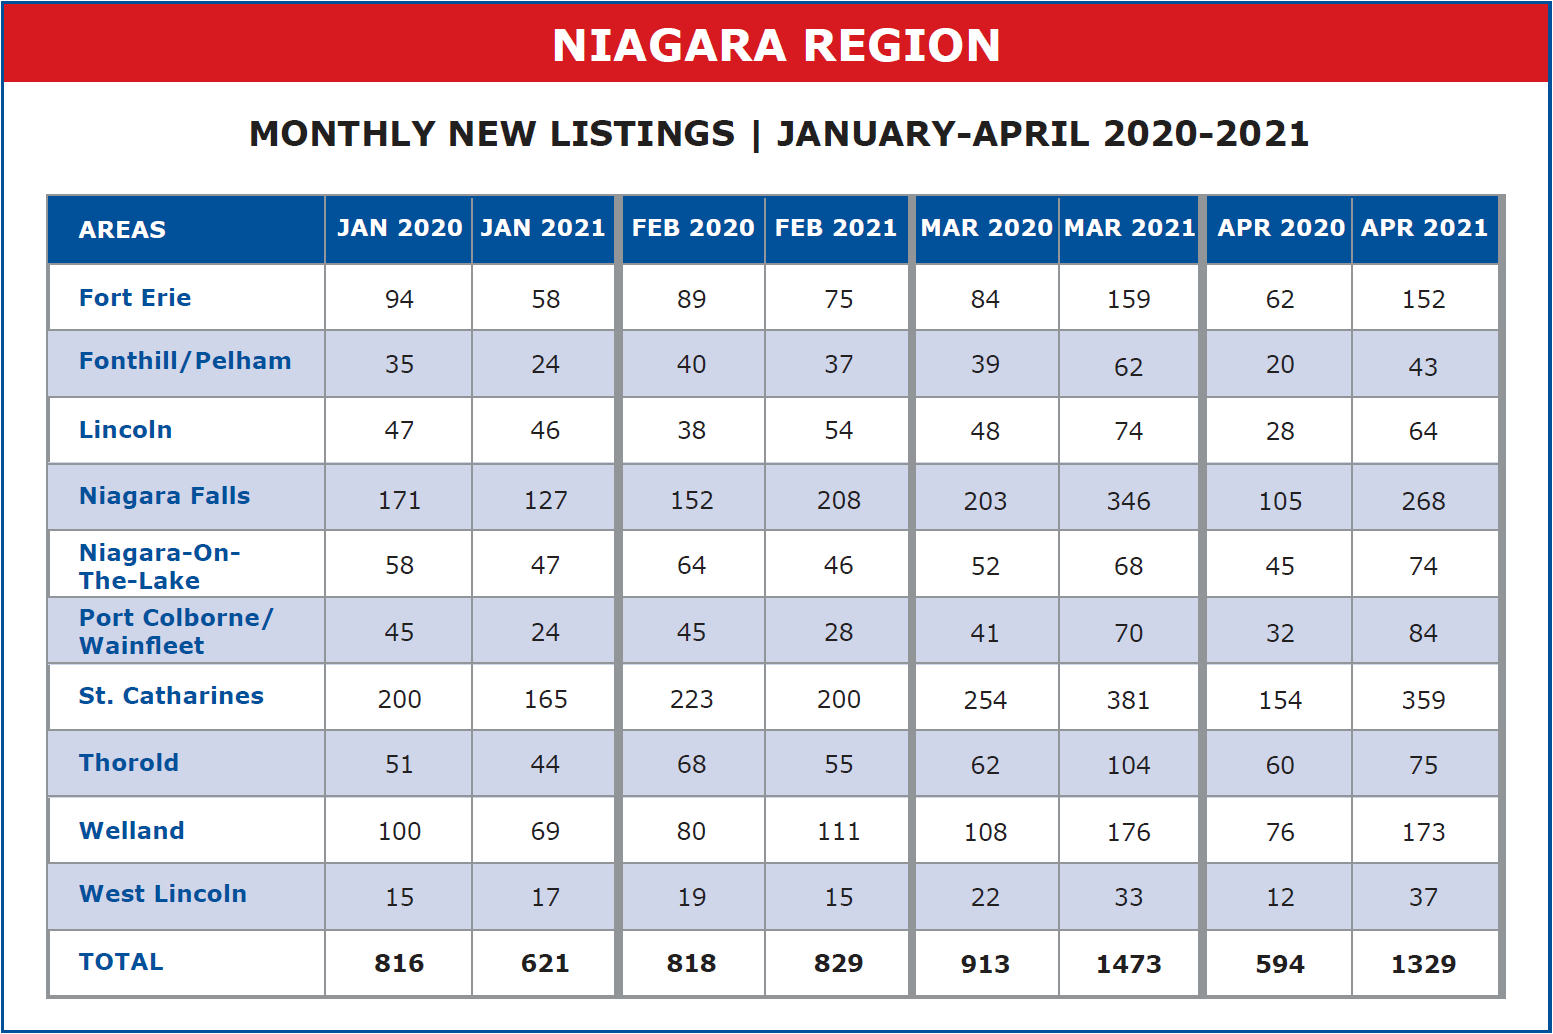
The month of April 2021 recorded a total of 1,329 new listings coming into the system. That is down 144 or 9.77% from last month’s total of 1,473 but still up a whopping 735 or 123.7% from the 594 registered a year ago in April 2020. Of course, last April was the first month of COVID-19 and most people were trying to get their head around the new pandemic reality. Real estate was almost at a standstill.
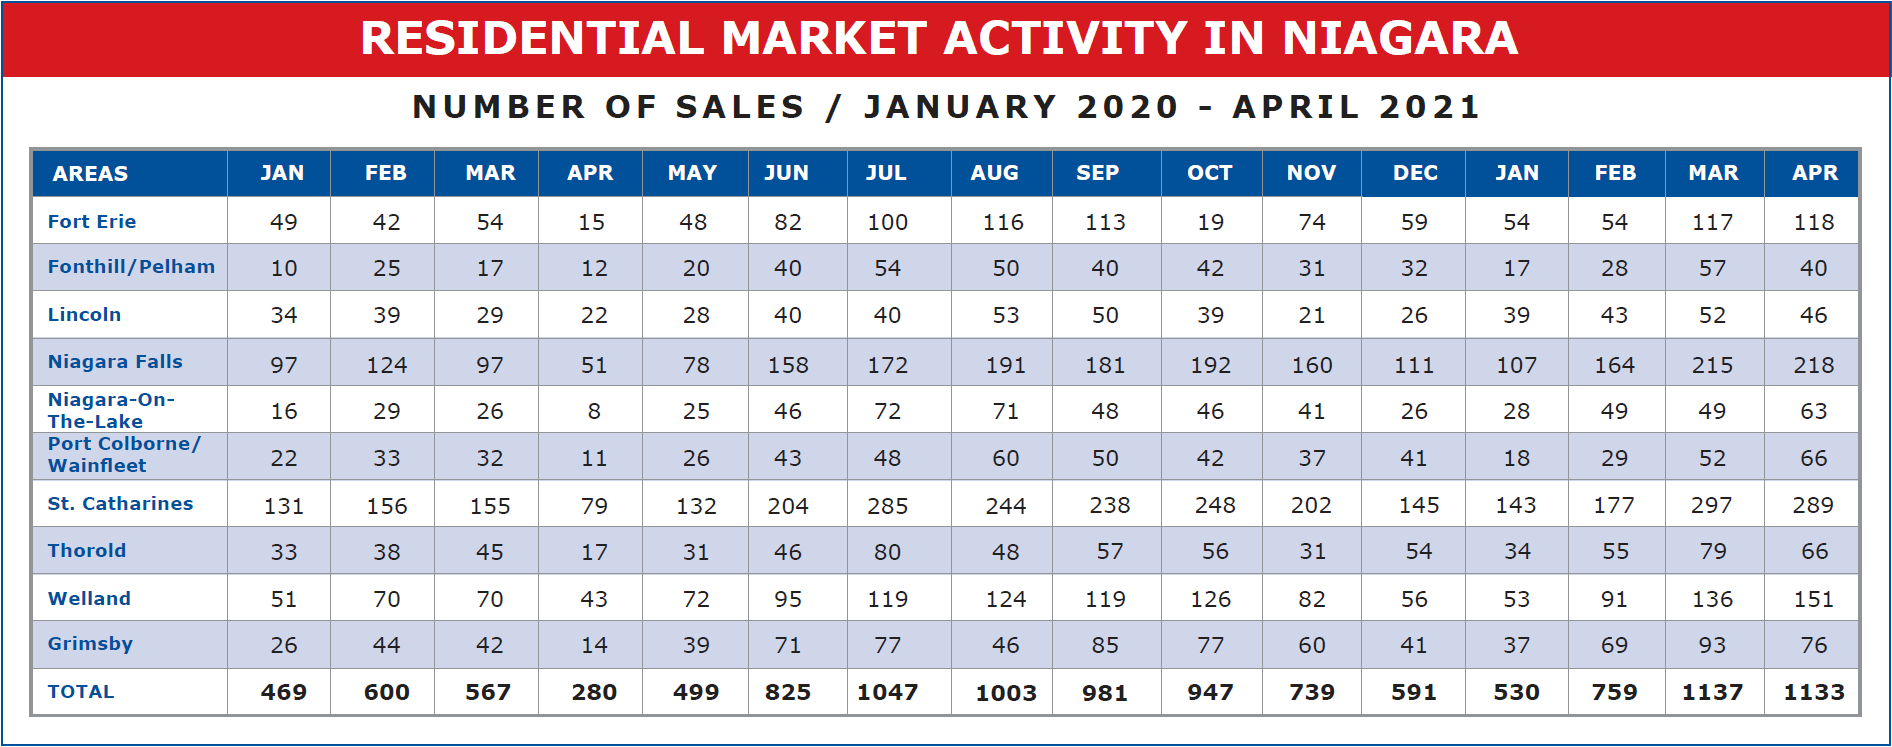
We touched on ‘months of available inventory, a measure of how long it would take to use up all current listings if no new properties came on the market. So, with new listings down somewhat, was there a corresponding drop in unit sales for the month, or are we going to experience even tighter availability? Well, interestingly enough, April 2021 saw the total sales across the Region come in at 1,133. That is virtually unchanged from the 1,137 recorded last month, March 2021. So, we can expect an even tighter supply in the days ahead. At the same time, consider that one year ago, April 2020 recorded only 280 sales across the Region. So, this month saw an increase of 853 units or 304.64% up from a year ago.
As we did last month, let's put the sales totals, month by month, over the past 5 years on a graph, so we can more readily see the changes.
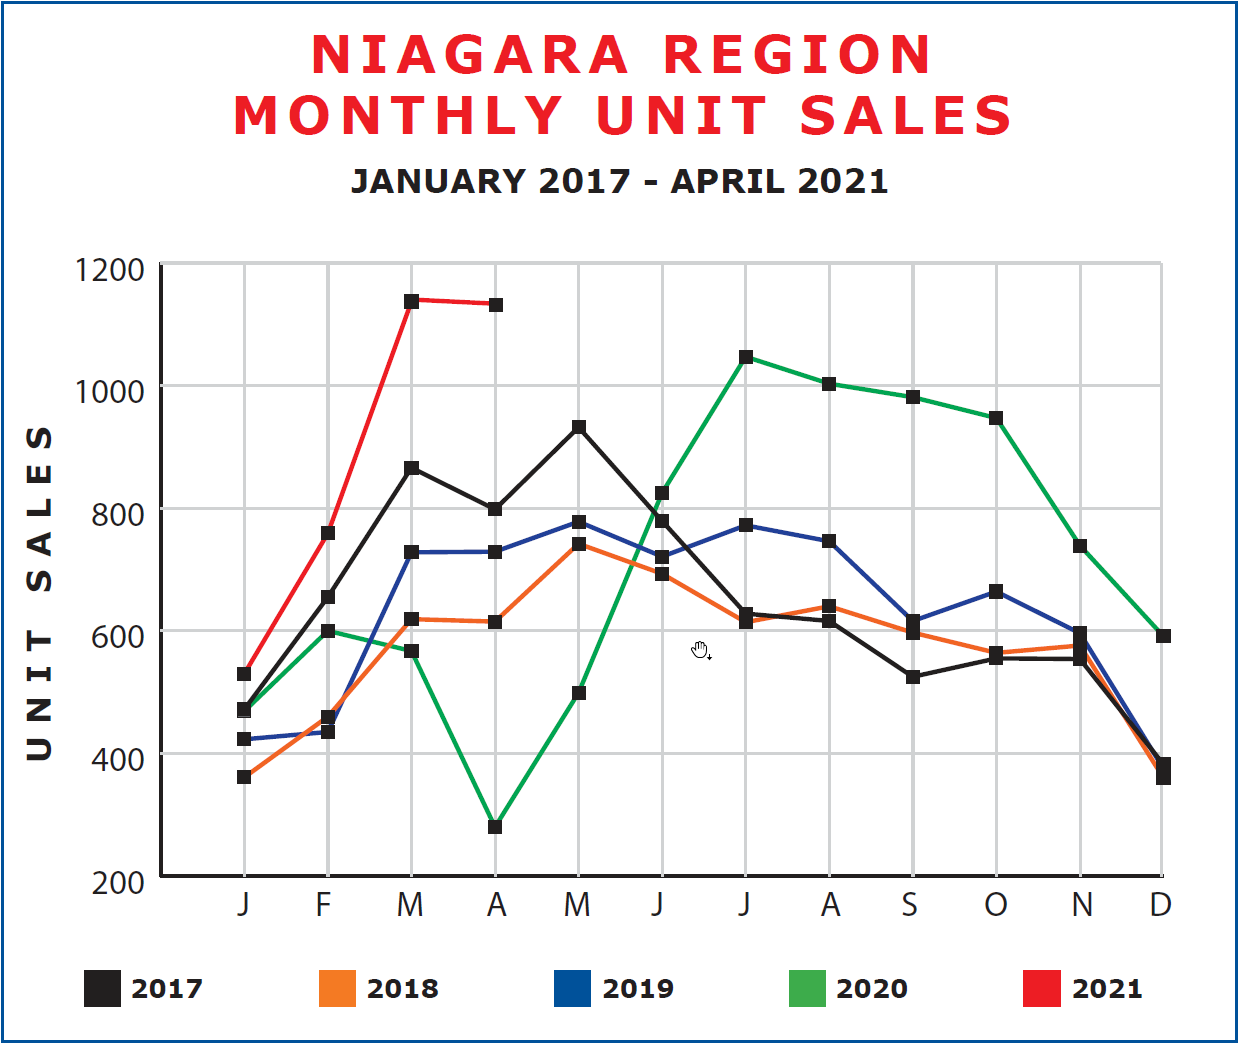
You will notice a couple of interesting things from the graph. First, note that the unit sales from March to April dropped an insignificant amount in 2021 but remained in all time record territory. At the same time, it’s interesting to note that in each of the past five years, sales volumes dropped somewhat in April compared to March (for whatever reason) and in every case, rebounded in May. It’ll be interesting to see what kind of numbers May 2021 holds for us.
Now, what about price? What’s happening there? Last month we saw a general leveling off of price across the Region after substantial gains in January and February. What did we see in April?
Have a look at the accompanying chart. Because of space constraints, I’ve limited our review to just the past 13 months, April 2020 to April 2021.
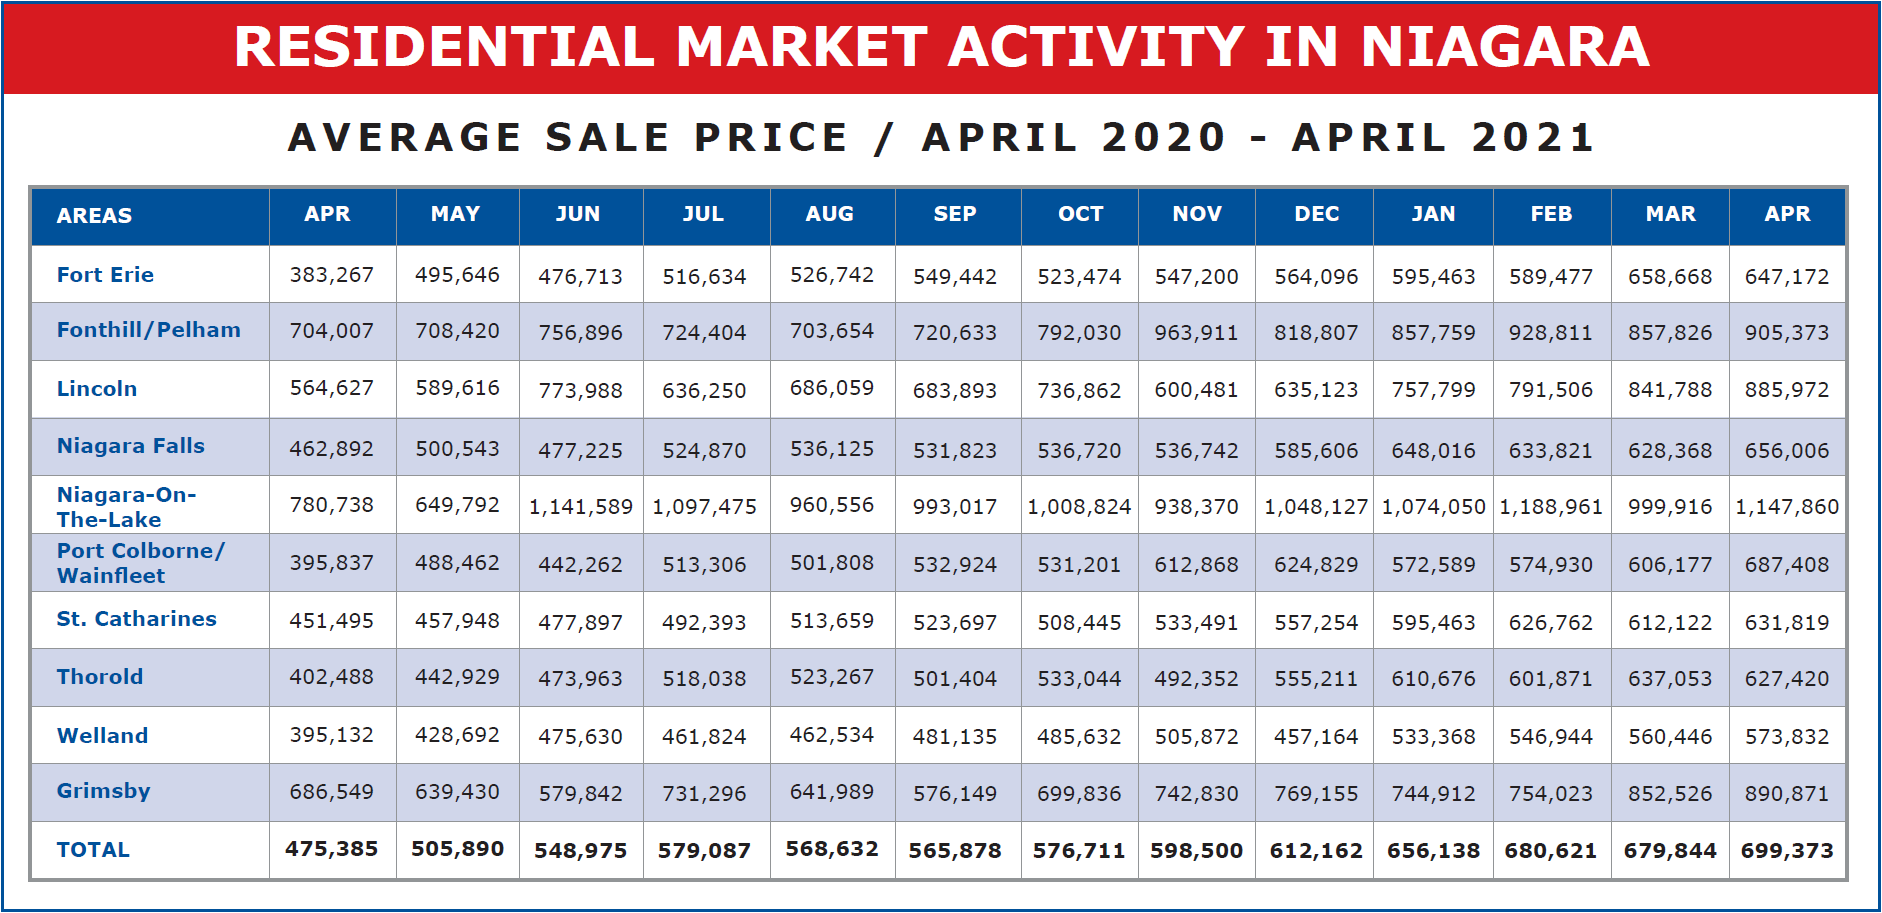
You will see the average sale price across the Region came in at $699,373 in April, an increase of $19,529 or 2.87% from the previous month. And when compared to the $612,162 at year-end sales, that’s an increase of $87,211 or 14.25% in the first 4 months of the year. And compared to the $475,385 set one year ago, in April 2020, that’s a year over year increase of $223,988 or 47.12%. To be fair, April 2020 did register a drop due to the onset of COVID but even compared to February or March 2020, pre-COVID, we are still seeing an increase from then to now in the 40% range. And that’s remarkable.
So, as we noted last month, we aren’t seeing the frenzied bidding quite the same as we did a month or so ago, but from the numbers, that’s not an indication of reduced sales volume or average price. The days ahead should prove very interesting indeed.