August 16th 2021
 We’ve been tracking the market pretty closely month by month, especially since the brisk run we saw in 2017, the impact of the Government imposed foreign buyers spec. tax and mortgage stress test in the Spring of 2017, then the unprecedented worldwide pandemic commencing in the Spring of 2020. All these have had an impact to be sure. What we want to do, if we can, is try to examine market fluctuations in the light of these events, factoring in normal seasonal changes and see if we can see patterns and trends. The idea is to get an overview as to how the market has responded to date and see if we can get a handle perhaps on where it is going in the future.
I think we are all aware by now, of the roller coaster effect COVID-19 has had on real estate, not just here in Niagara, or limited to Canada, but around the globe. After a near shutdown of activity in April and May 2020, the market really took off. People were literally lined up to buy real estate. Multiple offers were the norm. Prices skyrocketed, as did total unit sales.
The feeling over the past 2-3 months, however, is that that frenzied activity has tapered off. Real estate salespeople are seeing fewer bidding wars. And while prices occasionally come in much higher than asking, more often than not, they do not. Of course, part of that is that more and more realtors are listing at market value, rather than ‘under pricing’ their properties in an attempt to promote competition.
But, rather than relying on the ‘feeling’ of the marketplace, let's look at the actual data. Beginning with unit sales.
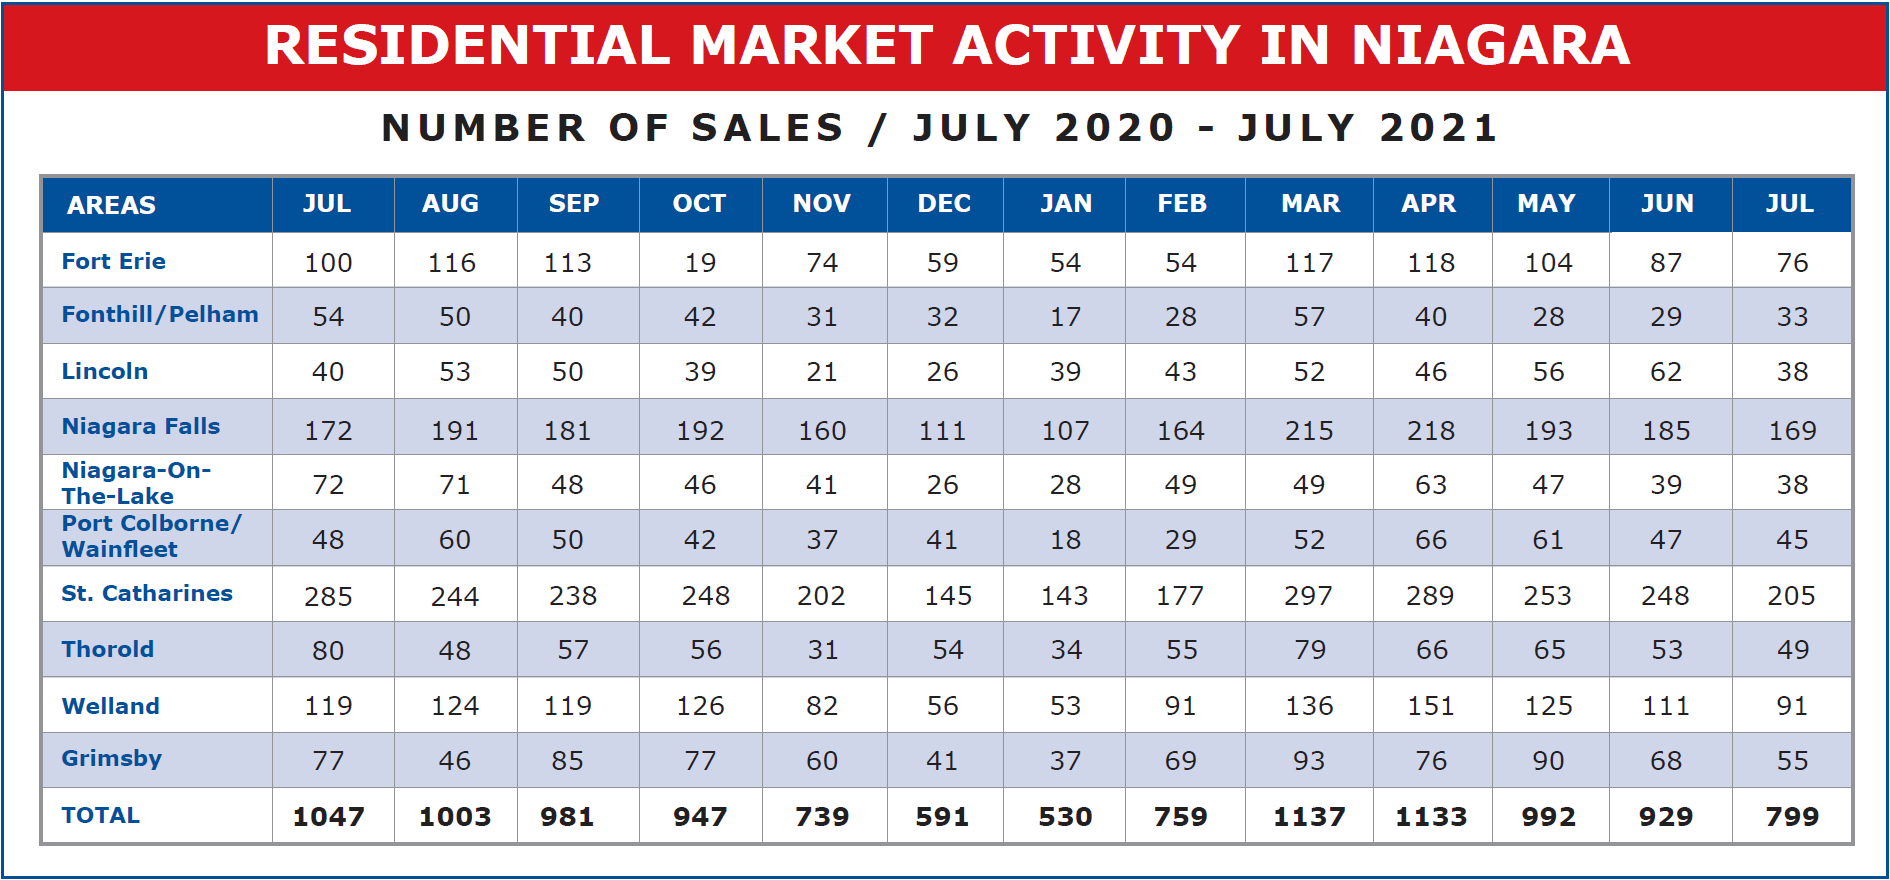
We see that in July, 799 sales were registered across the region. When we compare that to the 1,047 in July of 2020, we see that’s down 248 units or 23.7%. Bear in mind, however, that July 2020 set a monthly record for sales in 2020, rebounding from the near shut down of April and May. The fact that we are down from one year ago is not surprising.
What is surprising, however, is that that 799 number is a drop of 130 units or 14.0% from last month. In fact, we have seen a drop in sales activity each month since March where 1,137 units were sold. Part of that is normal seasonal adjustments. Traditionally we think of the spring as being the strongest time of the year for sales. Activity naturally drops off through to the end of the year. When we transfer unit sales onto a graph and look at how 2021 compares to the previous 5 years, we get a clearer idea.
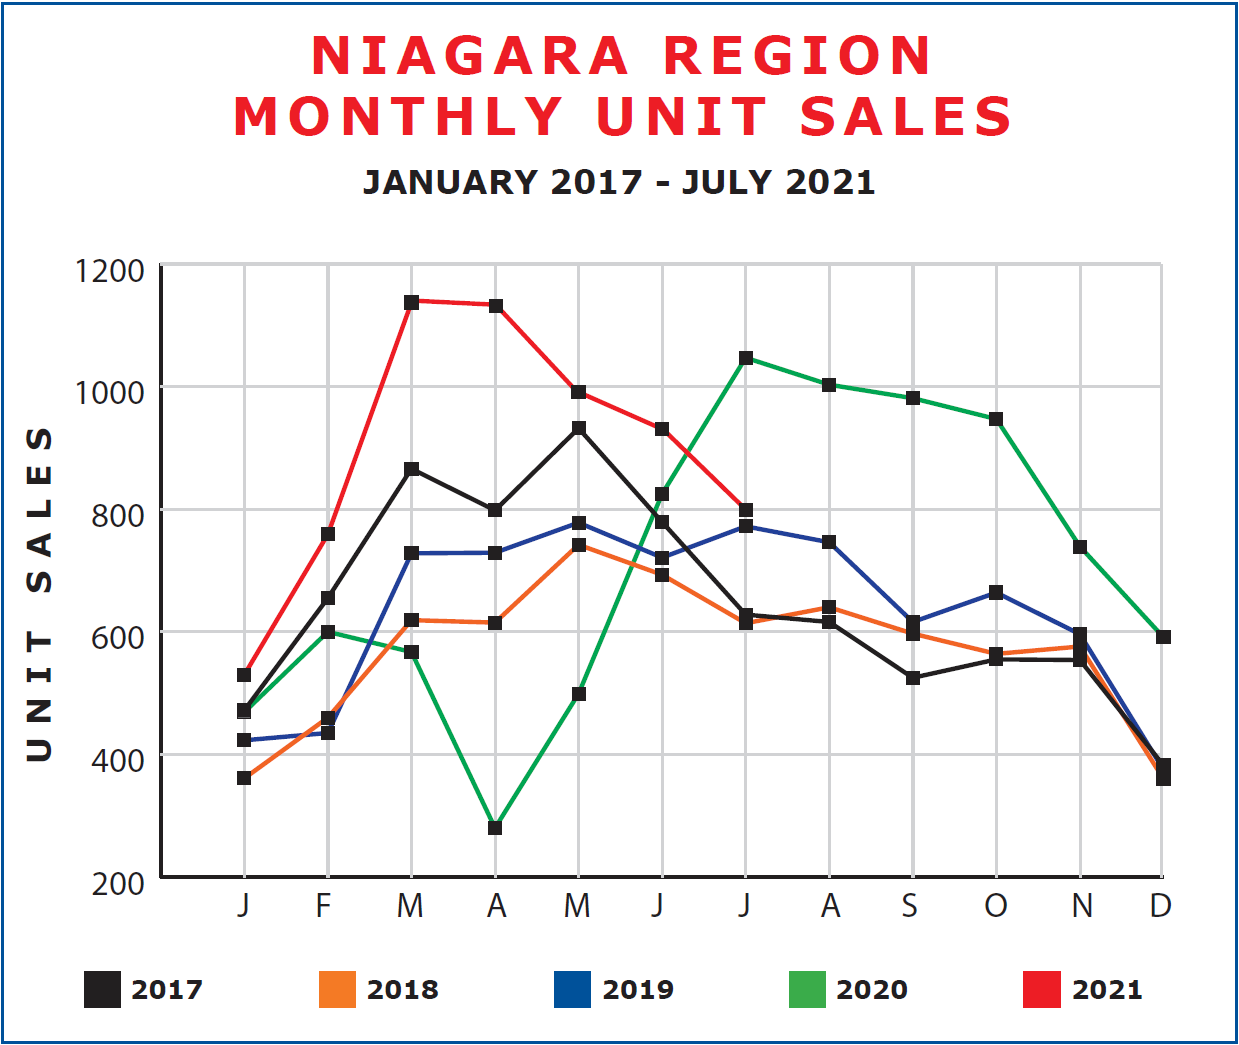
We can see that yes, July’s sales are indeed down from March, April, May, and June. But at the same time unit sales for July are at or above those registered for the same month in 2017, 2018 or 2019. So, while the feeling is that the market has really slowed down, it’s actually moved into what has traditionally been a steady and healthy market pace.
Now, what about the price? If there are fewer sales being recorded than we saw in the previous few months, and if bidding wars are on the decline, shouldn’t that be reflected in what properties are selling for? One would think so. But again, looking at the numbers, that simply isn’t the case.
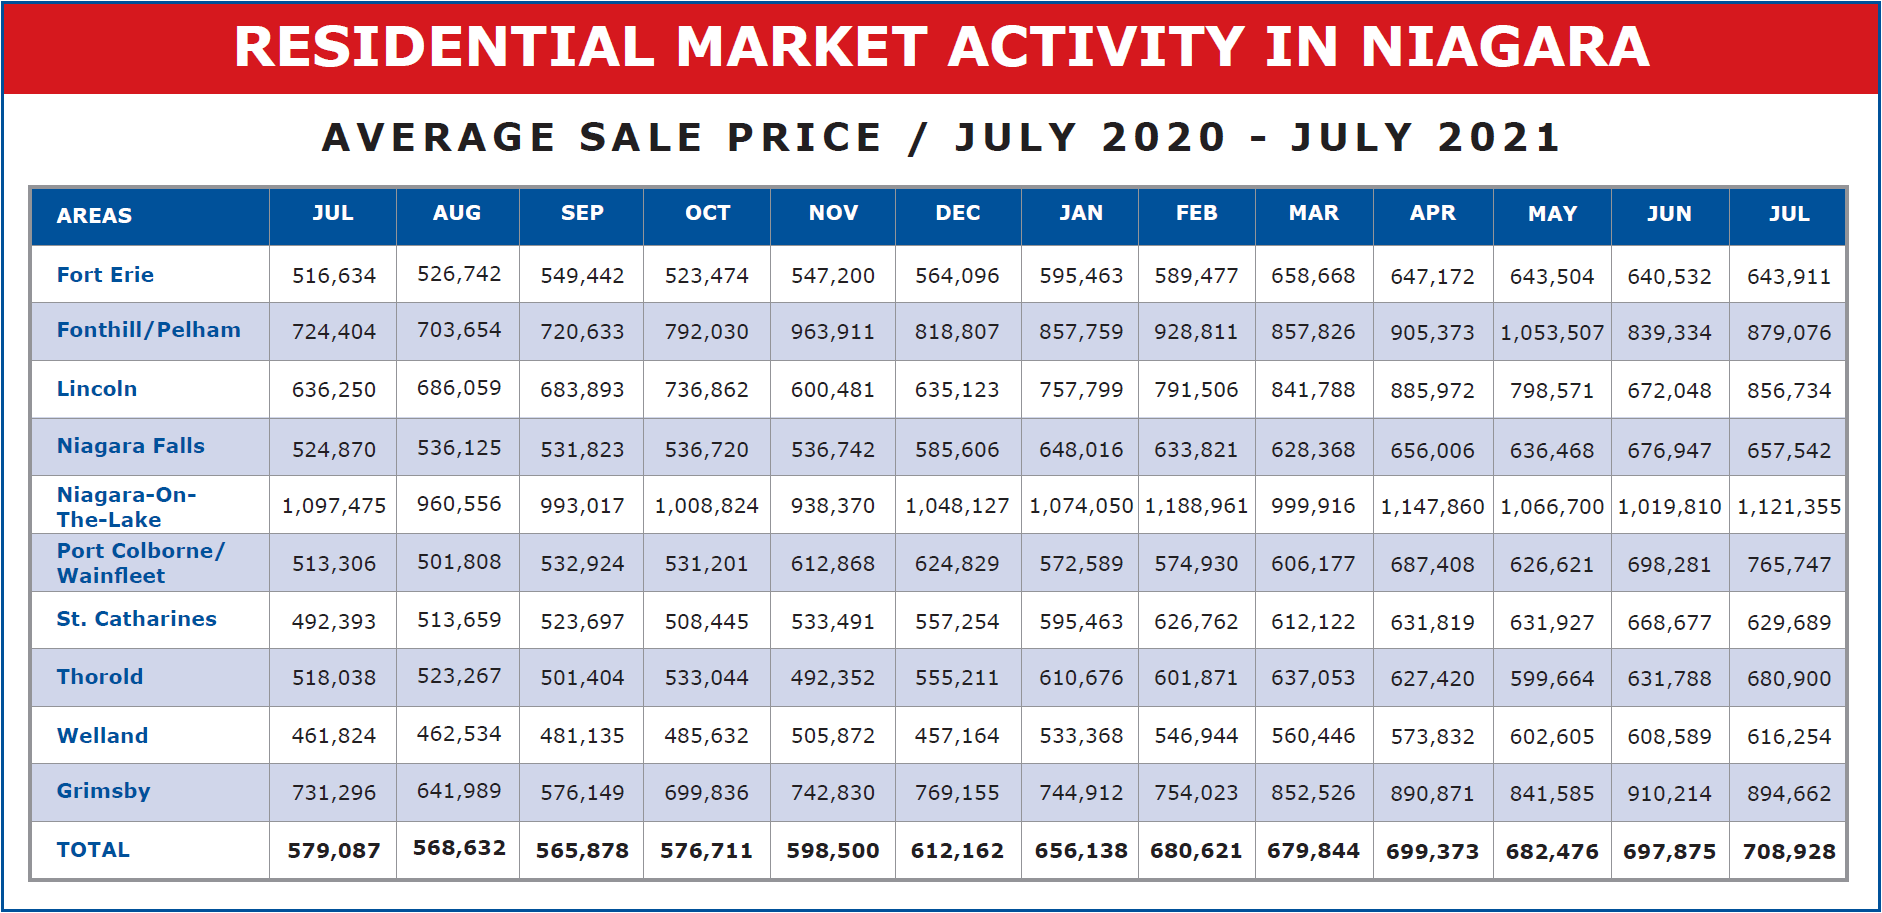
Have a look at the average sale price across the region for July. $708,928. That’s up $11,053 or 1.58% from June. Up $96,766 or 15.81% from the start of the year and up $132,798 or 23.05% from July 2020. Now, not all municipalities fared the same. St. Catharines, for example really took it on the chin, coming in at an average of $629,689, down $38,988 or 5.83% from June. But even then that $629,689 represents an increase of $72,435 or 13.0% from year-end 2020 and an increase of $137,296 or 27.88% from July 2020.
It’ll be interesting to see where we go from here. Traditionally price gains are made in the first half of the year, with things flattening out in the fall and winter. I don’t expect that will change for 2021. We’ve had our market expectations altered over the past couple of years, but it would appear from the numbers that we’re now in a very strong, steady, normal market. Prices in all likelihood will not increase much through the balance of 2021, seeing a growth of about 15% annually. And as we enter into 2022, the forecasters are predicting continued steady but moderate growth.
Stay tuned. We’ll keep you posted.