July 10th 2021
 For anyone watching the Real Estate Market closely, and especially those who work in it day in and day out, there is a feeling that things are shifting. For a couple of months now it would seem that the market is in transition. But is it?
To really get an understanding of what is happening in the real estate market, there are a number of key indicators to follow: total number of sales, otal number of new listings, number of days of inventory, average sale price, and so on. Each has a story to tell. And looking at any one of these pieces of information will give us a snapshot of where we are. But to understand what is happening and perhaps forecast where we are going, we need to look at historical data. And not just a year-over-year comparison but monthly changes to see how these trends hold up against patterns in the past.
As we’ve been in the habit of doing, let's zero in on two key factors: unit sales and average sale price, both critical indicators of the relative strength of the market.
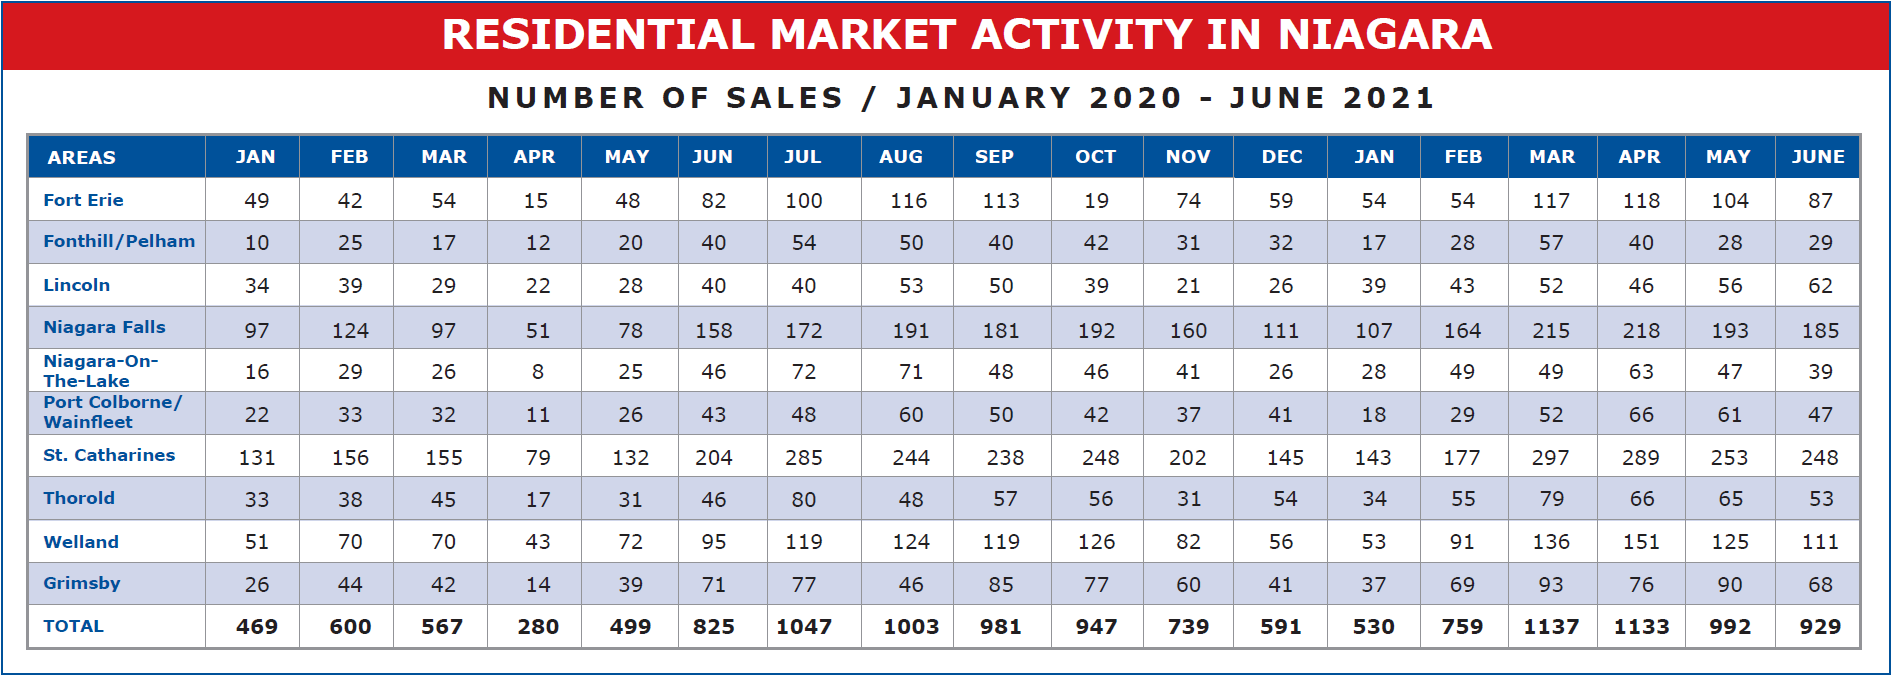
Beginning with unit sales, we saw last month that the total number of sales in May came in at 992, down 141 units or 12.44% from the 1,133 recorded in April. And now with June figures in, we see the sales in June came in at 929. Down again! Down a total of 63 units or 6.35% from May.
Those who are seeing an overall slowdown in the marketplace see this as support for that theory. But that is not necessarily the case.
To gain a better understanding, we need to compare what is happening in 2021 to what occurred in previous years and see if there is a consistency in the trends. Let’s look at the historical data over the past 5 years in graph format.
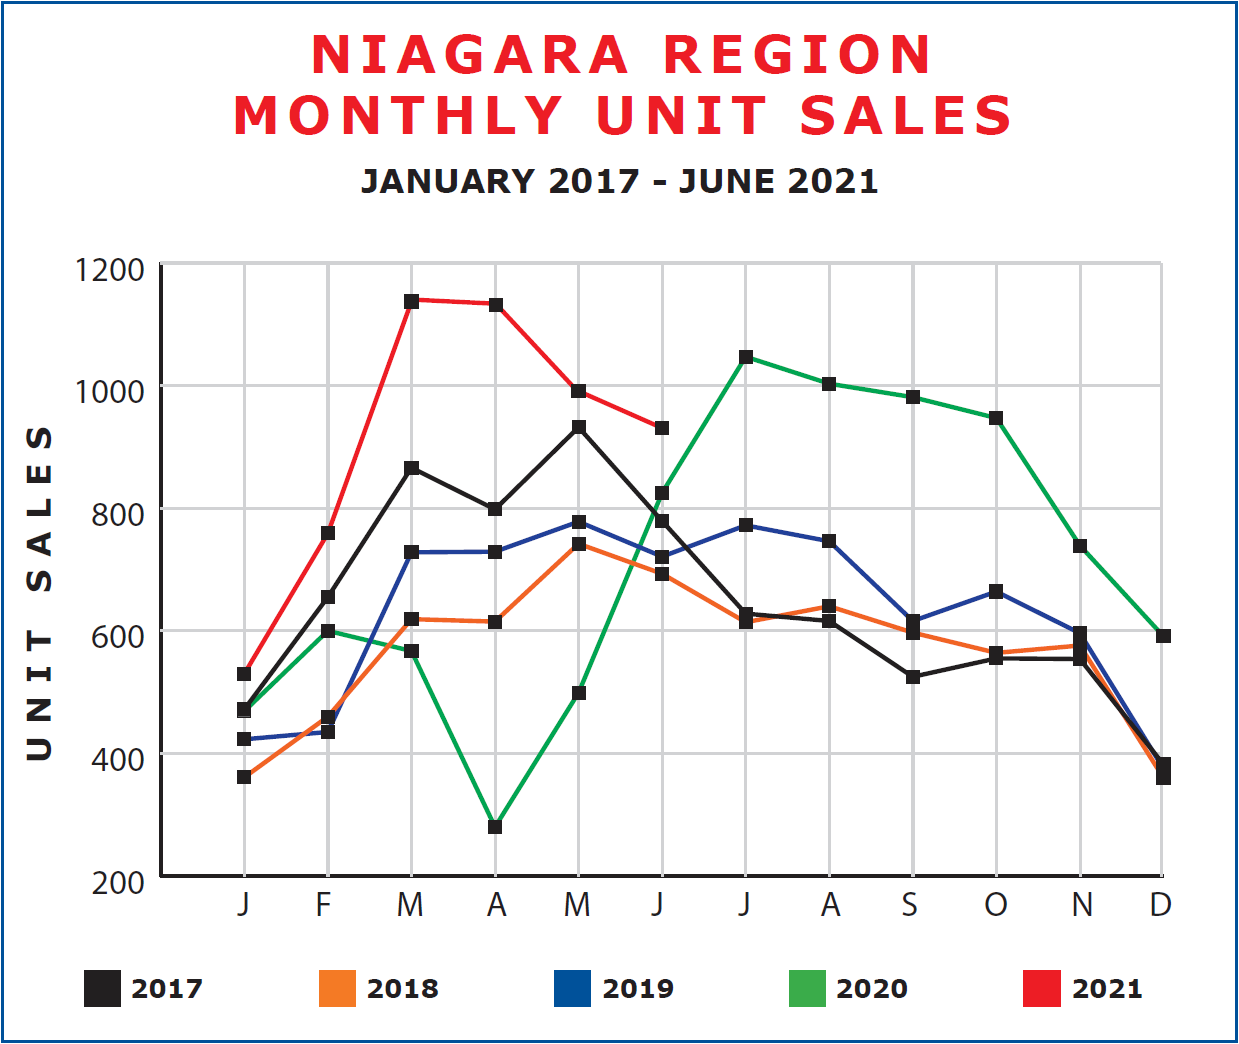
The first thing that jumps out at us and which we discussed last month is the fact that the unit sale drop in May was a departure from the norm. Over the past 4 years, every May saw an increase in unit sales over the previous month. But not May 2021. So we wondered, was this an indication of a downward trend, or was it merely a response to the newly imposed COVID-19 lockdown imposed on the Province and in Niagara? Well, look at June. As we’ve seen, June is again down from May. But here this is in keeping with the norm. Every year but 2020, when we were bouncing back from the devastation of the Pandemic, June has seen a drop in unit sales from the previous month. A mild drop, reflective of the transition from Spring to Summer. And that is what we are seeing this year. Overall sales in June are down slightly from May but still remain very strong. In fact, above the June sales totals of any of the past years, including 2020.
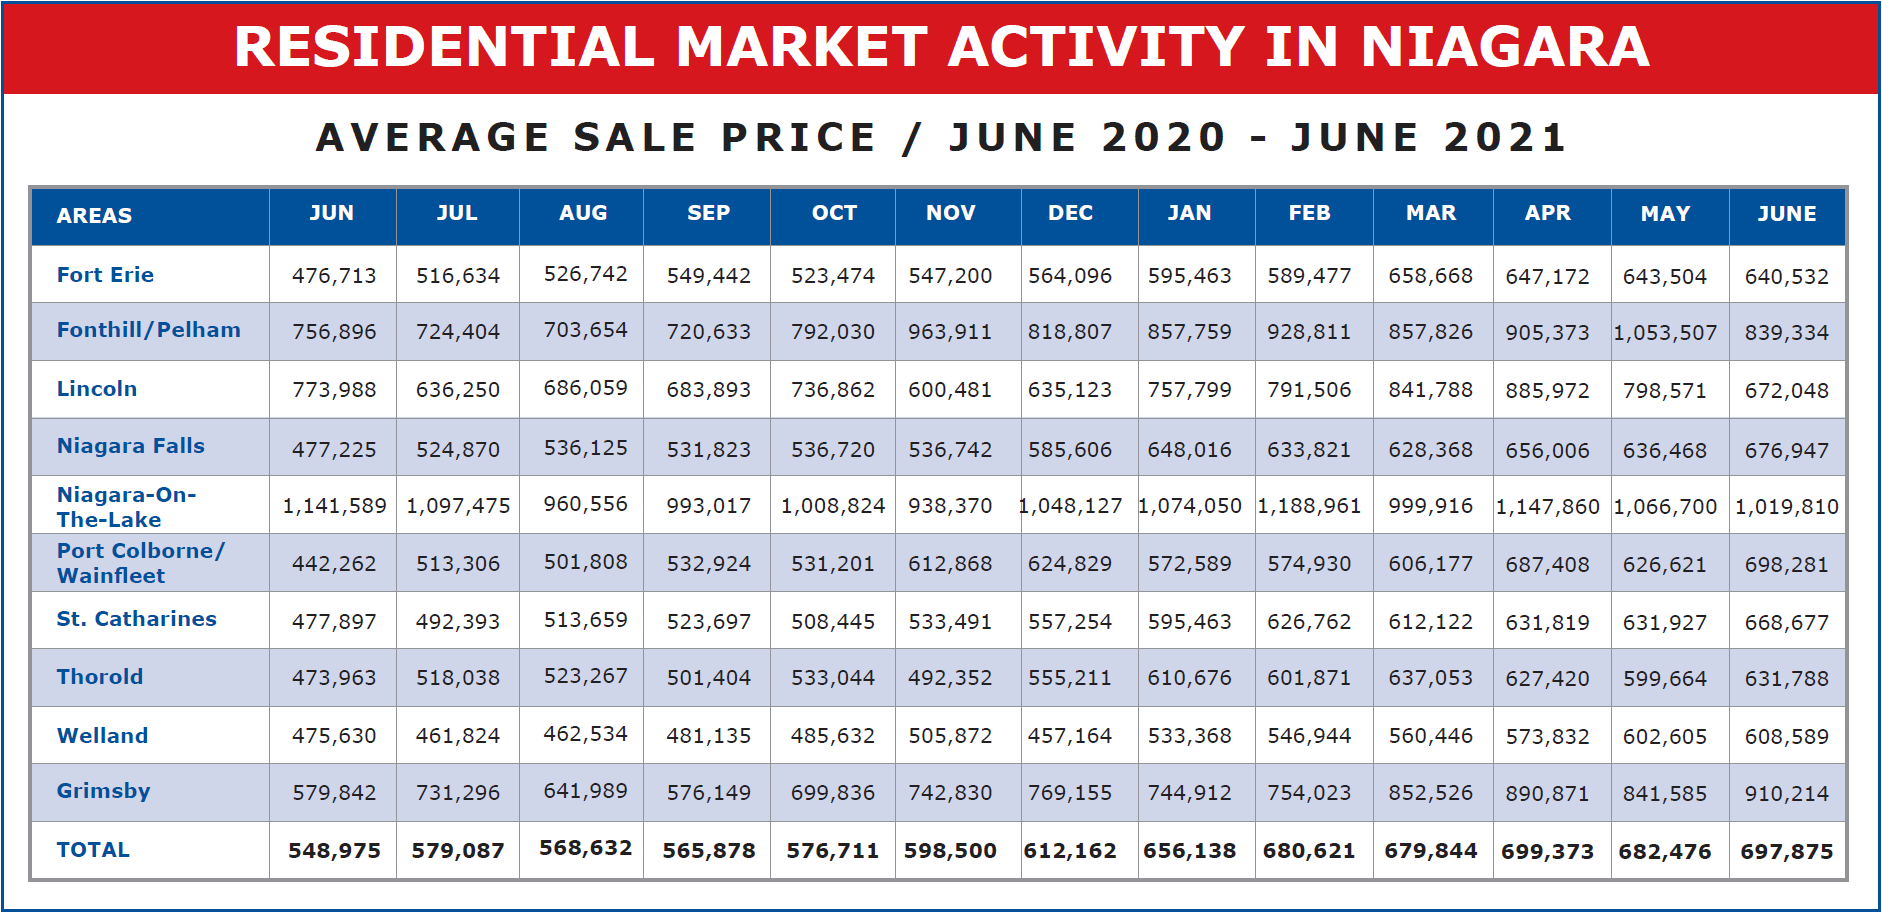
But now let’s take a minute and look at the price. Last month we saw the average sale price across the Region slip $16,897 or 2.4% from the previous months figure. That’s minimal. It could be standard monthly fluctuation. It’s in that range. Or it could, like some people are suggesting, be a downward trend. So, what’s happened in June?
Interestingly enough, the average sale price in June is back up to $697,875. That’s an increase of $15,399 or 2.3%, bringing us back in line with where we were in April. Back into record territory. And while we are seeing significant fluctuations in price from one municipality to another, our two biggest areas of size and unit sales, St. Catharines and Niagara Falls, are up month over month 5.8% and 6.4% respectively. Both registering all-time highs for average sale price for June.
So, in summary, we are seeing some changes in the marketplace. Not as many competing offers. Agents often listing at or close to market value rather than below with delays in presentation. But analyzing the numbers in the light of past performance, there really isn’t any indication of ‘softening’ in the marketplace either in price or in unit sales, at this point in time.