May 18th 2020
The sales figures are now in for April and they are beginning to give us a pretty good idea of the impact the COVID-19 Pandemic is having on the real estate market. As I’m sure you are well aware, the year 2020 started out extremely strong. Lots of demand. Lots of multiple offers. Properties often going over asking price. The COVID-19 virus was not really on anyone’s radar screen here in North America, although it had in fact begun to rear its ugly head in Wuhan, China.
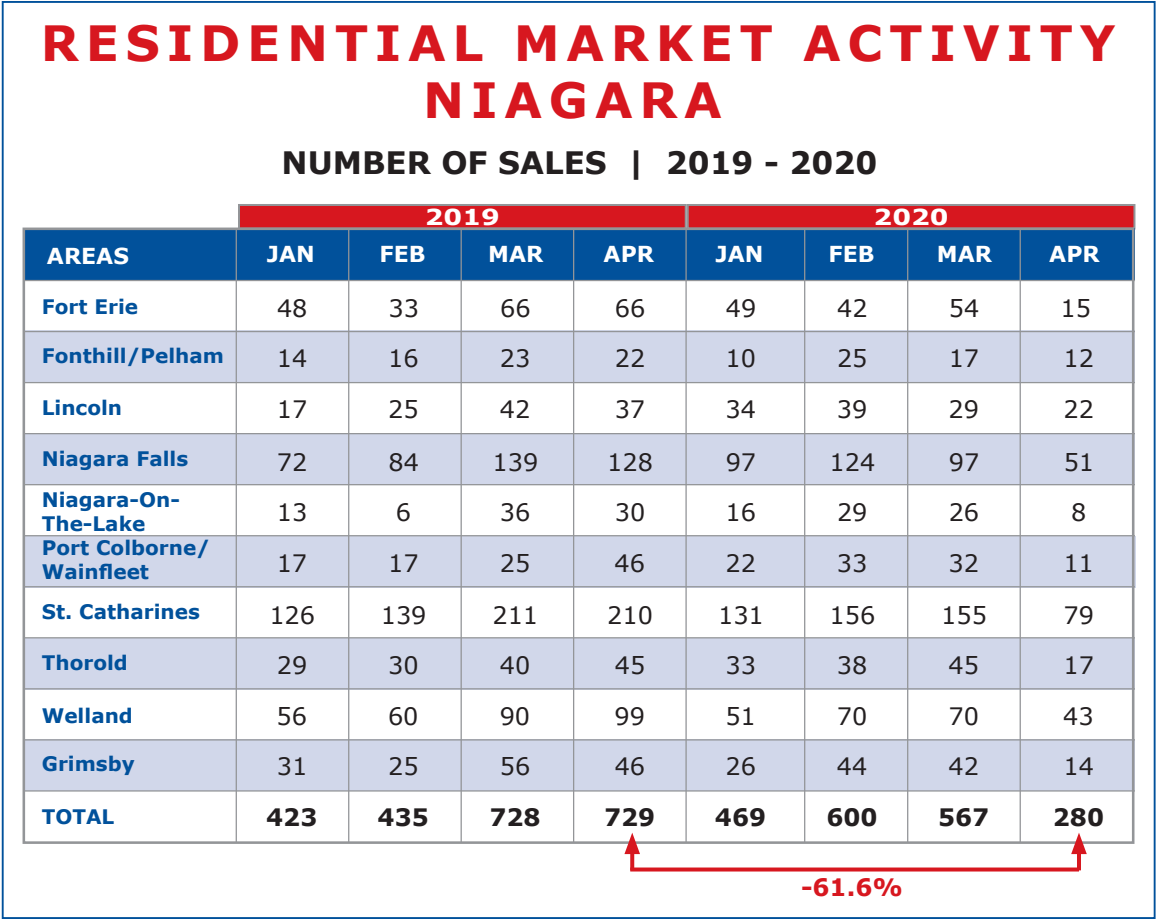
The market momentum continued well into February. As you’ll see in the chart below, January registered a total of 469 sales this year compared to 423 sales in January 2019. That represented an increase of 10.9%. But by February of this year that sales total hit 600 units compared with only 435 in February 2019. An increase of 37.97%.
Then in March that all began to change. Early March the threat of COVID-19 was apparent here in Canada. In the first half of the month the World Health Organization declared COVID-19 a World Pandemic, and by mid March restrictive measures began to take effect. Gatherings were limited first to 250, then to 50, then to 10. Social distancing was recommended and people, especially people at risk, were told to self isolate.
Although real estate was declared an essential service and allowed to continue operations, people were reluctant to go out and view properties, and sellers were equally reluctant to have strangers wonder about their homes. By month end real estate transactions were cut to a trickle. When March should have seen a strong increase in numbers of sales compared to February, the sales units actually dropped. Coming in at 567 compared to 728 in the corresponding month in 2019. A drop of 22.1%. Bear in mind these are total sales figures for the month. March actually started out strong. All the lost momentum occurred in the last half of the month, where it’s estimated that sales were down as much as 90%.
*Sales data provided by the Niagara Association of Realtors and the Hamilton-Burlington Realtors Association as submitted through Brokerage Members inputted MLS sales.
Moving on to April, that slowdown became abundantly clear. In 2019 there were 729 residential sales registered in the Niagara Region. Then April this year, that number had shrunk to a mere 280, a drop of 61.6%.
Although we don’t have actual figures to back it up, it would seem from activity around this office, that what we saw by way of decline in March is slowly beginning to reverse in April. The month started out about 90% down, but soon that activity improved to about 70% down and now it is running at just under half what it was to the corresponding period last year.
And what we see here in Niagara, is pretty much a mirror image of what is going on throughout Ontario, especially in the Golden Horseshoe. By way of illustration, I have included a chart of sales activity in our neighboring Real Estate Association of Hamilton-Burlington. As you can see, here too the overall sales volume for April is down 62.9%. Almost identical to the drop in Niagara.
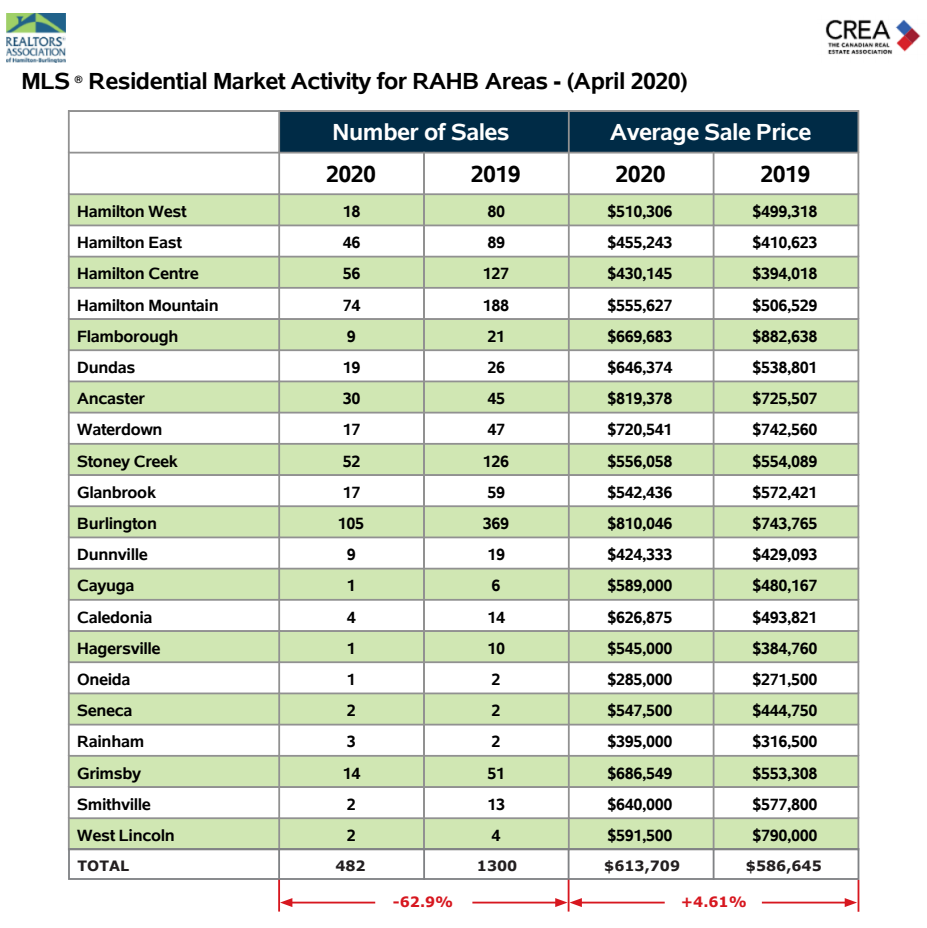
Of course, number of sales in the marketplace is only half the story. The other critical component is average sale price. What is happening there? Looking again at the above noted chart for the Realtors Association of Hamilton-Burlington, you’ll see also included is the average residential sale price for each municipality as recorded April 2020 and compared to the corresponding month last year. And while, depending on size of sample, the figures vary, overall the Board showed an increase of 4.61% year over year.
And if we look at the report of average sale price across Niagara, we see a very similar picture. A year over year increase of 7.86%.
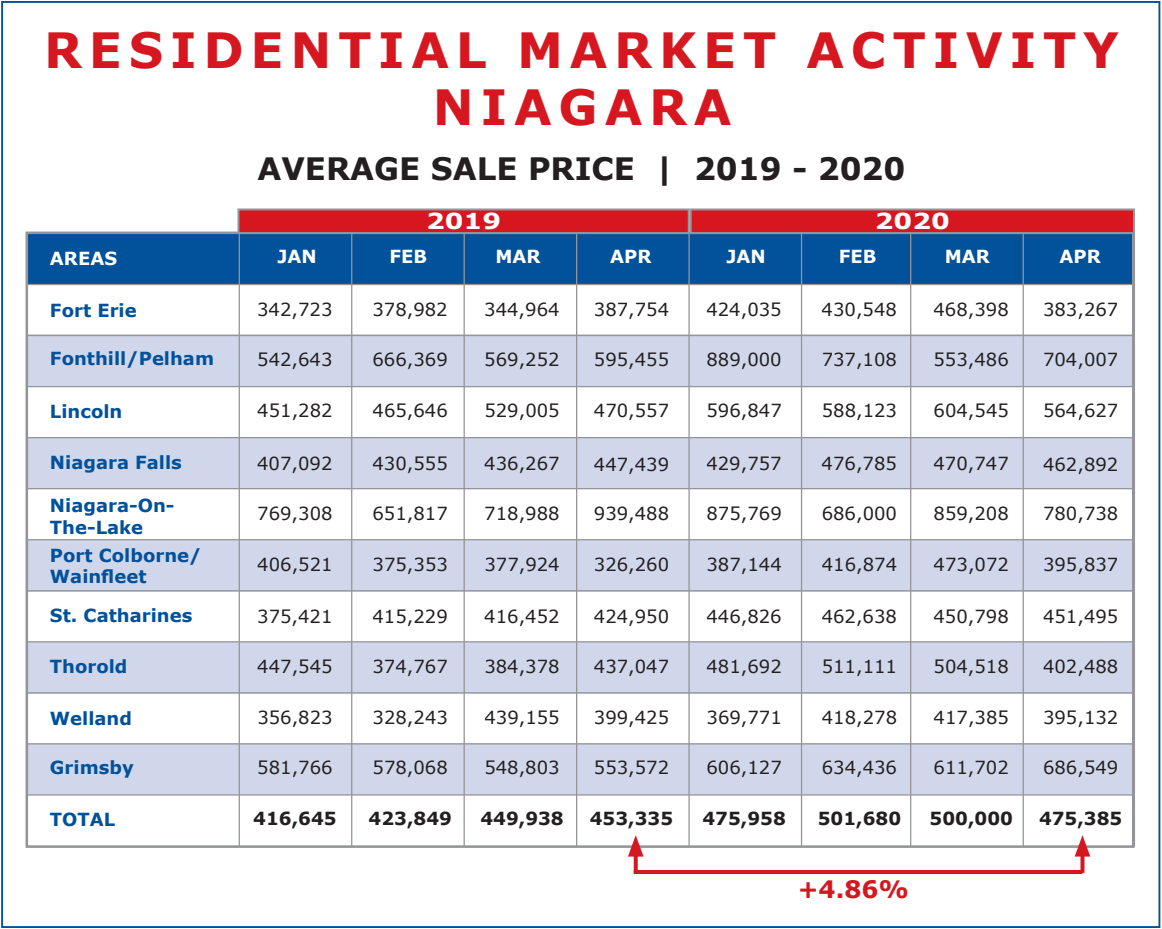
In our Niagara chart we have included each of the first four months average prices for both 2019 and 2020. You will notice that price gains were made in both January and February 2020, but March saw a leveling out of prices across the region and in April the average sale price dropped by about 5%. As we’ve seen before, this happens from time to time, between one month and the next, but I think what is happening here is more reflective of the marketplace. For the most part, with the drop of activity we are not seeing a lot of multiple offer situations that tend to overbid the prices. As a result prices have settled a bit, and this may continue to happen in the days ahead until volumes get back to normal and beyond. The fact that prices are so marginally affected at a time where sales activity has dropped by more than half is a tribute to the overall fundamental strength of the housing sector. I expect, as restrictions are gradually lifted, we will see an increase in market activity, and as the momentum increases, at some point the fulcrum will tip and prices will once again begin their upward climb.