May 15th 2023
It’s been a roller coaster ride when it comes to prices in Niagara ever since the onset of Covid. But in fact it goes back even further than that. Going back all the way to 2017 we have seen price gains in residential properties that were for a number of years previously just unheard of. In fact over the calendar year 2017 average prices grew by just over 25%. That’s in one year alone. And then with the exception of March and April 2020, prices during the Covid era grew pretty much monthly from $475,958 in January 2020 for two full years to February of 2022 where the average reached $863,057. An increase of $387,099 or 81.33%. Then the wheels fell off. From that time the average sale price lost ground every single month, right until January 2023 where the average registered only $627,561. That’s a total loss of $235,496 or 27.29%
And that’s when things changed again. February 2023 saw an increase in prices of $35,212 ending an 11-month slide. And I’m glad to report that that wasn’t just a one-month fluke, but rather more of a trend.
March the average price in the region grew by another $31,507, and now again in April another gain of $24,251. So all told, prices since January 2023 have risen by $90,970 or 14.50%, or compared to year-end 2022, a gain of $62,194 or 9.47%
What that means in effect is that the total post-Covid price loss has been reduced from 27.29% down to $144,526 or 16.75%. Still a sizeable amount but not nearly as staggering. By way of illustrations have a look at the price trends for 2022 and 2023 as depicted on a graph.
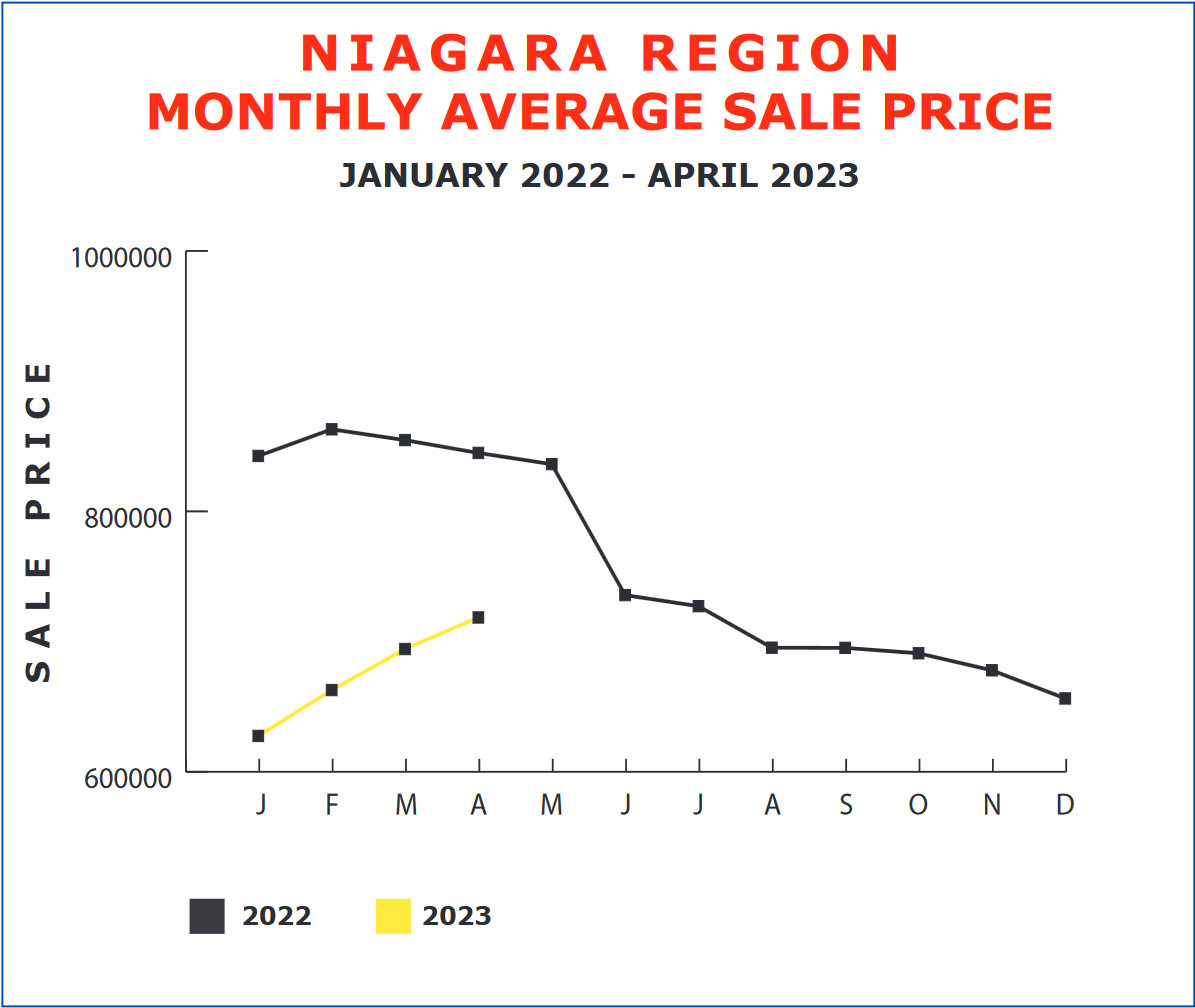
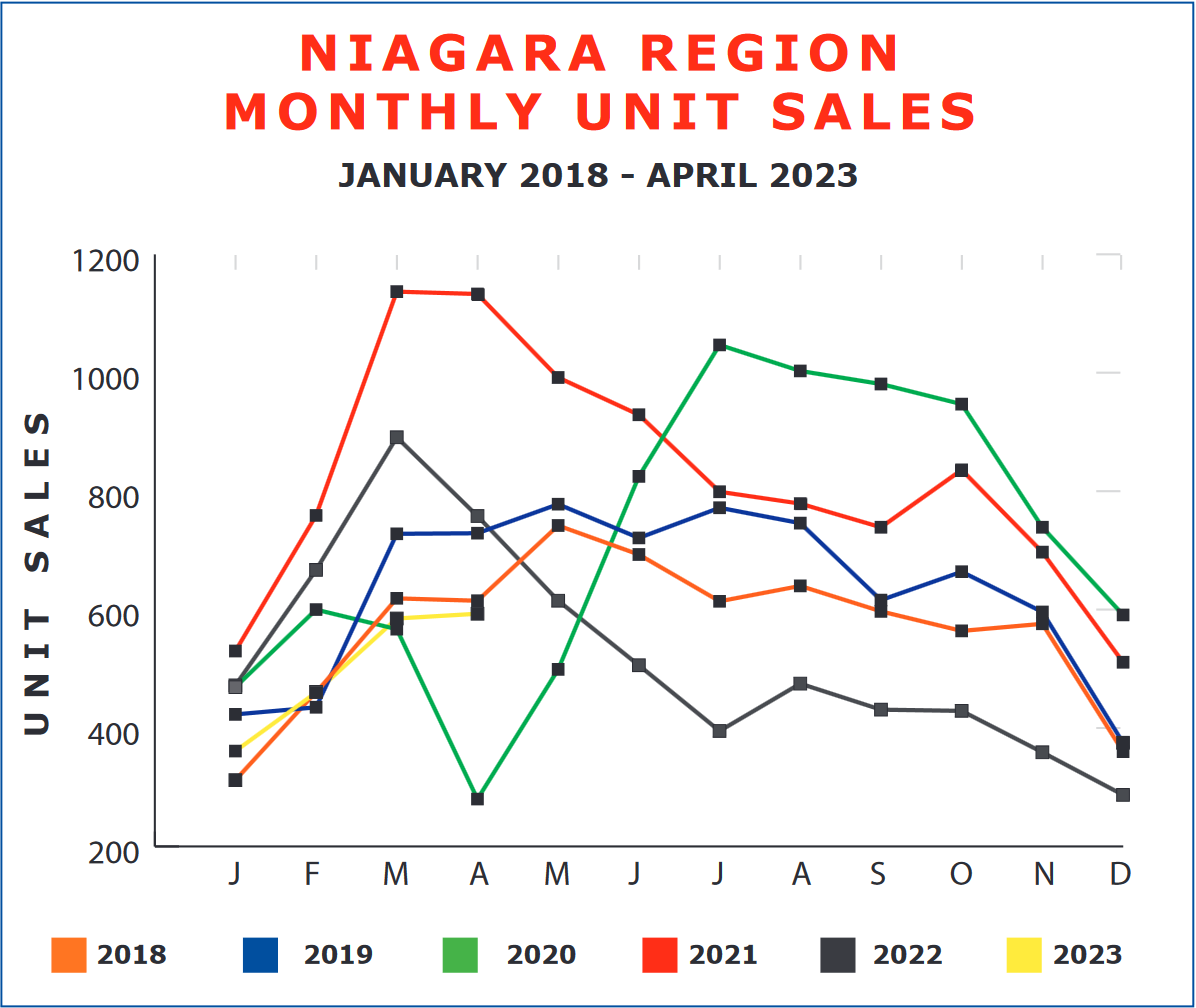
Will the market continue to gain ground at this accelerated clip? It’s hard to say. Traditionally the most sizeable gains occur in the spring, and we can see by both the graph and the numbers that the gains have slowed somewhat in April as compared to March, but 3 steady months of gains would indicate an upward trend. I believe as I’ve said for some time, that there is a pent-up desire on the part of a lot of consumers to get back in the game. And the price increases along with the deceleration of interest rates may be just the signal that the market has been looking for. The one area of concern in an otherwise positive report and outlook continues to be overall activity in the marketplace. Unit sales continue to be sluggish. And while the total unit sales in April came in slightly above March, 593 compared to 585, they still lag far behind the 758 recorded one year ago or the impressive 1,133 of April 2021. That’s a decline of 21.8% from one year ago and a decline of 47.7% from two years ago. As you can see in the graph below, with the exception of 2020 and the onset of Covid, the market typically peaks in March, falls off slightly in April, and then tends to lose traction over the balance of the year. So hopefully, we will see the numbers climb slightly as the market stabilizes, but if tradition holds true, don’t be surprised if the unit sales numbers remain a little sluggish over 2023.
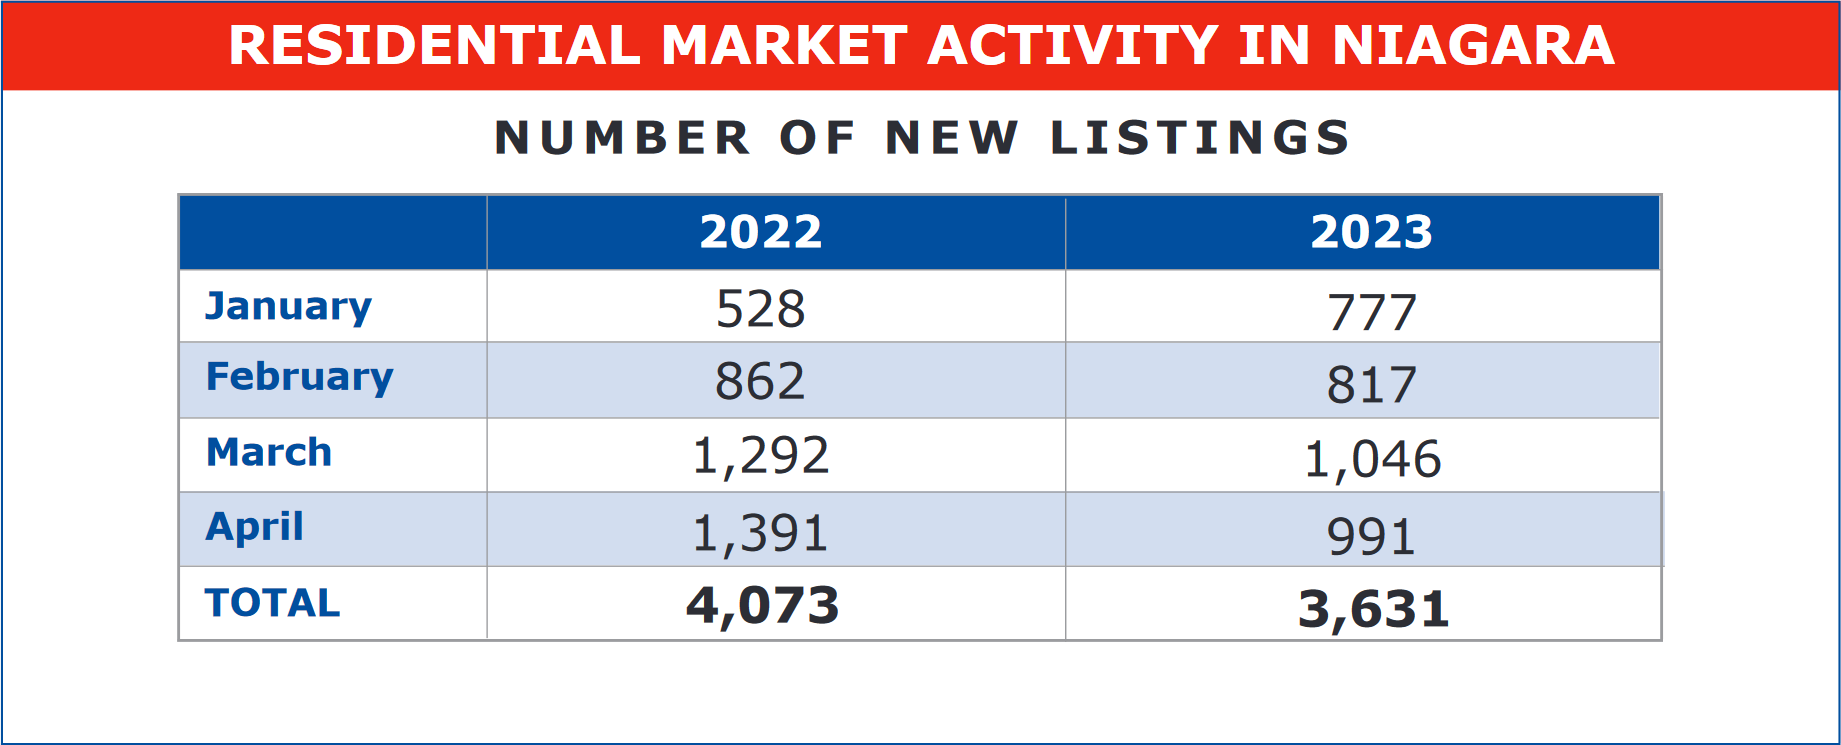
One other factor that plays into the dynamics of the marketplace is listing inventory. We don’t normally track new listings because the data isn’t very reliable. I mean by that that expired or terminated and relisted, or listings re-serviced track as new listings and so it is quite possible the same listing may be counted two or three times. However, as a relative comparison, let’s take a look at new listings as recorded by the Board over the first four months of the year.