November 15th 2021
There are certain trends in real estate that are almost etched in stone. They are that consistent. We talk about a spring market, because traditionally that’s when most sales occur. Price gains! Most appreciation occurs in the first 6 months of the year, with the last 6 months maintaining, but not necessarily gaining ground. The market experiences a lull at year-end with mid-December to Mid-January being traditionally slow for sales volume. But one thing that COVID has succeeded in doing is altering many of those trends. As we’ve seen, in 2020 the ‘spring’ market was pushed back into the summer. That’s just one example.

We now have the sales figures in for October.
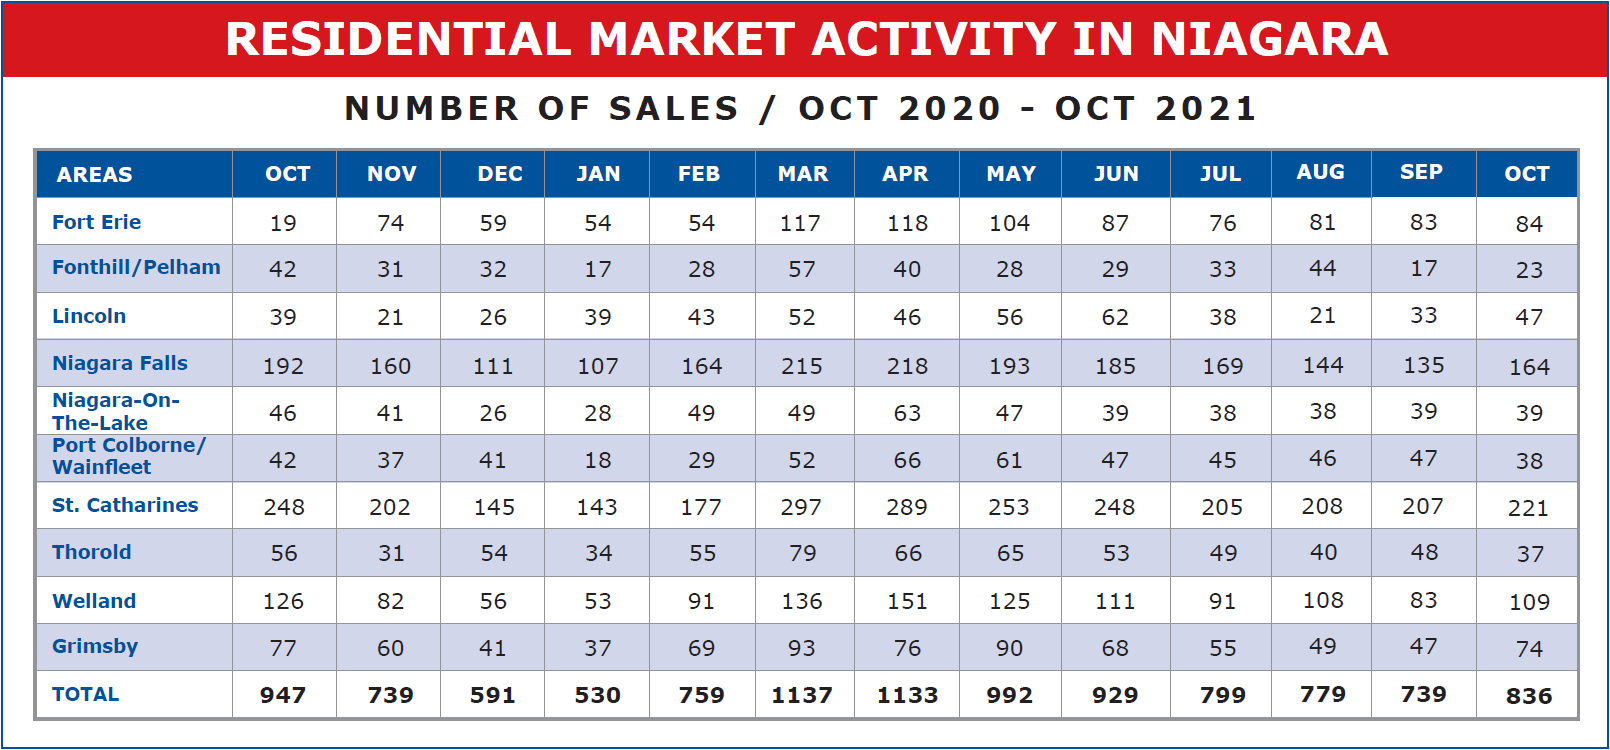
As you can see, across the region in the municipalities we track a total of 836 units were sold in October. And while that’s down 111 or 11.72% from the 947 recorded one year ago, it’s up 97 units or 13.13% from last month. That’s not totally unusual. Both 2017 and 2019 saw an uptick in unit sales in October. But not nearly as dramatically as this year. Have a look at the number of sales in graph format.
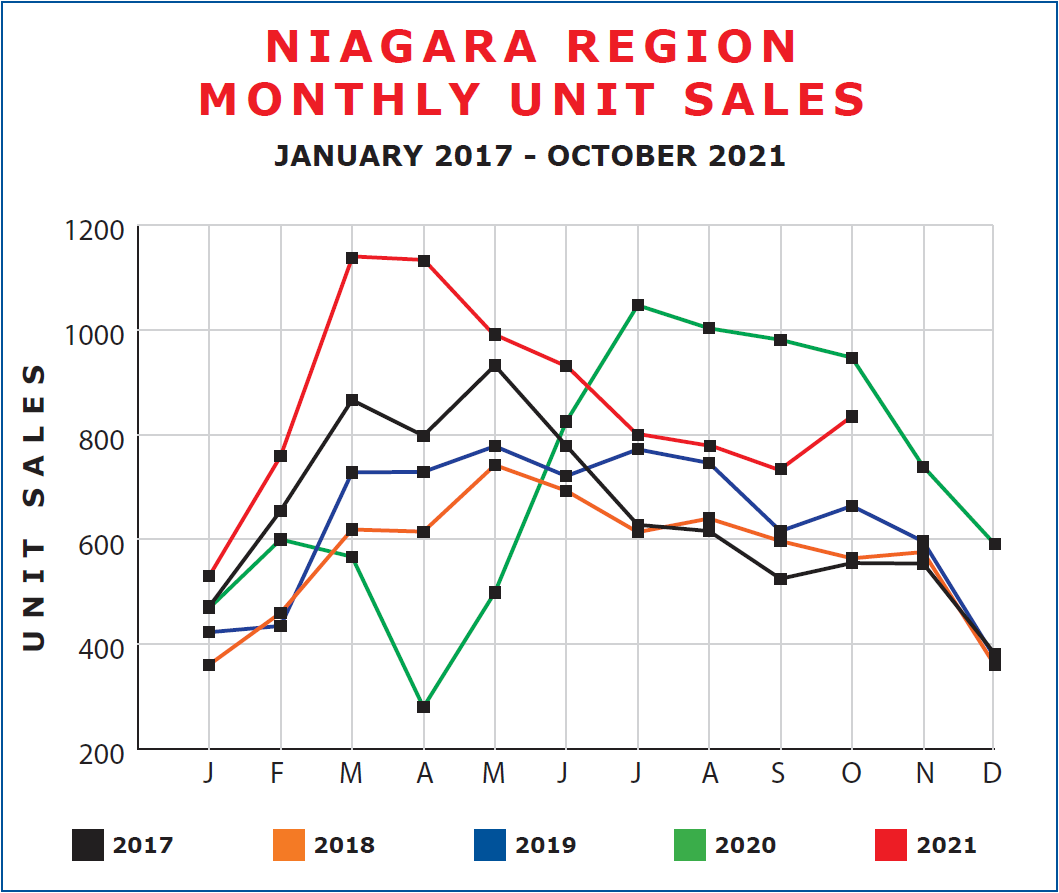
October 2021 not only registered more sales than September, but it also out-performed both July and August. And that is unusual. As you can see in the accompanying graph, unit sales have declined every month since April. But have spiked in October. Of course, those numbers will inevitably decline at year-end, but it is a clear indication of the growing interest in and demand for real estate here in Niagara.
But the other remarkable statistic is price. We’ve seen that traditionally prices tend to stagnate during the last half of the year. But that’s not what is happening now.
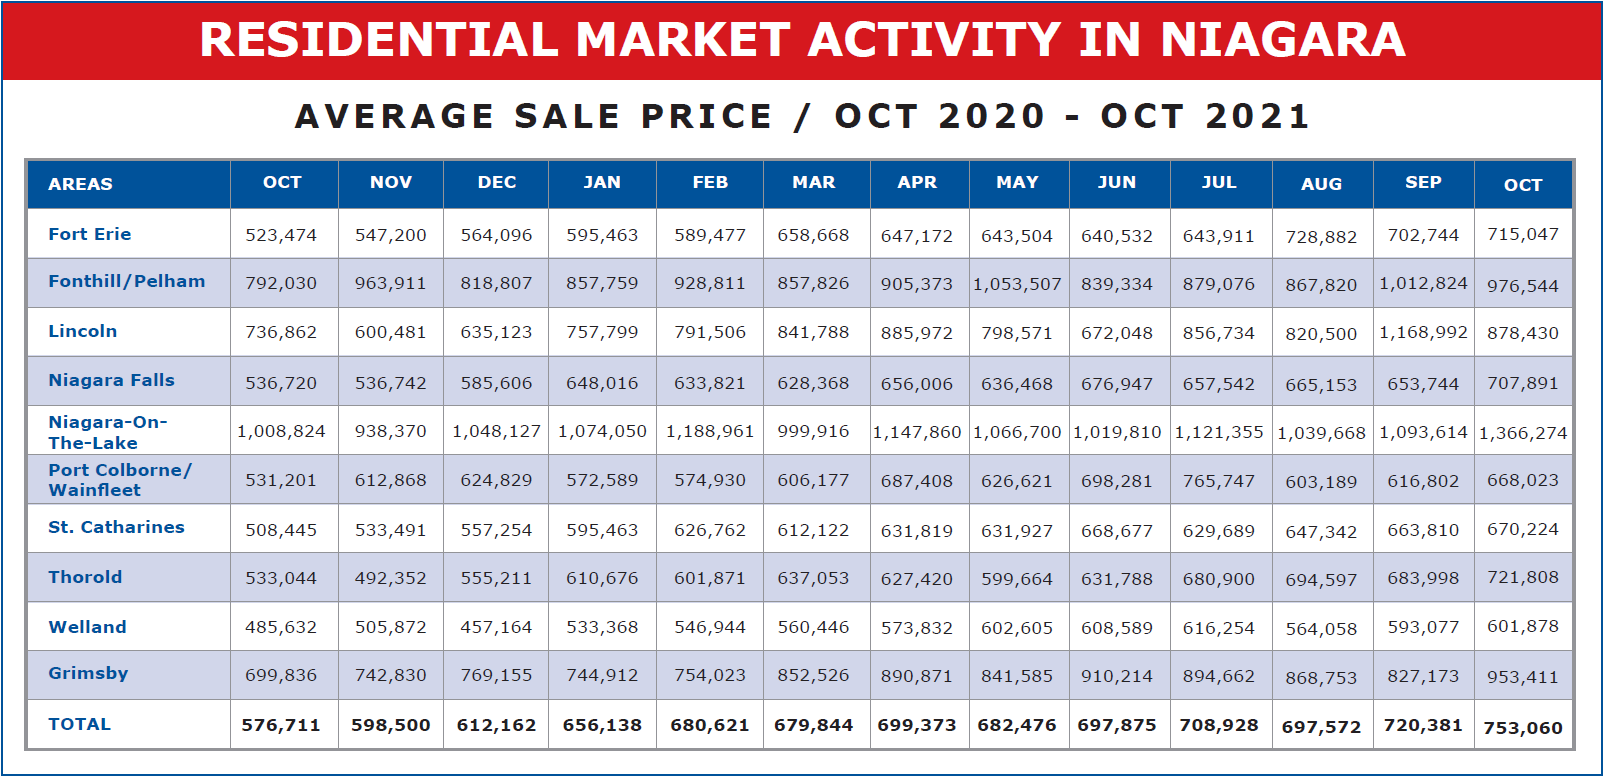
Across the region, the average sale price in October registered at $753,060. That’s up $32,679 or 4.54% from the $720,381 registered in September. 4.54% is just one month. And as we saw in last month’s report, September was also up $22,809 or 3.27% from August. And that’s not typical for a fall market. The region began the year at $612,162. To date we’re up $140,898 or 23.01% and year over year, we’re up $176,349 or 30.58%. That’s really remarkable.
To get a better appreciation of what’s been happening to prices, let’s again look at the last 4 or 5 years as depicted on a graph.
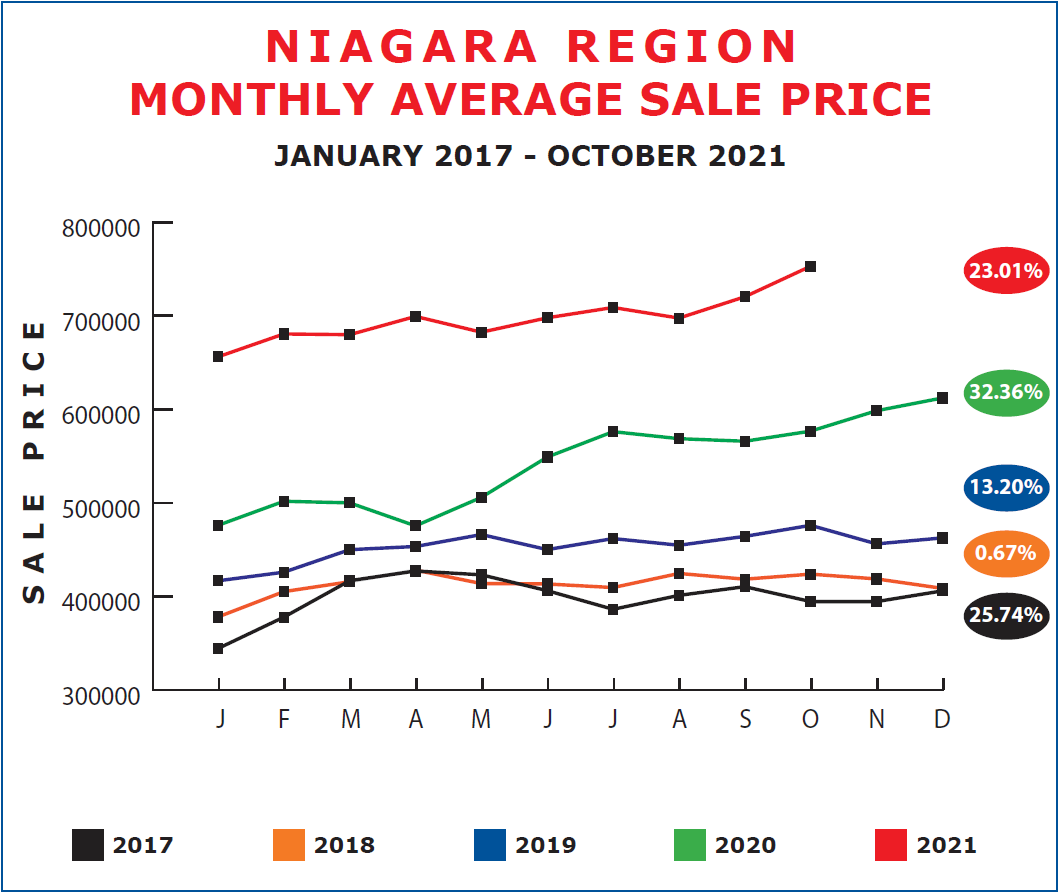
As you can see 2017, 2018, 2019 each showed price gains. 2017 especially. But look at what’s been happening during the COVID era of 2020 and 2021. Really since April-May of 2020 prices have been on a tear. And with no signs of let up.
One contributing factor which I referenced last month but which I don’t typically track via chart or graph is available inventory as registered by new listings. In September we saw that 994 new listings came in, down 163 or 14.09% from August. That number dropped again in October to 864, or 13.08%. Down another 130 units or 13.08%. Of course, one would expect new listings to slow in late fall and early winter. But here again we see new listings decline and at a time sales are increasing, putting pressure on available inventory and fueling competition among buyers.
I personally think the gains we’ve experienced over the past 3 or 4 years and especially in 2020 and 2021 were long overdue and are only helping us to catch up to where we should be relative to other areas in the G.T.A. It’s interesting to note that over the past 5 years Niagara’s prices have gone up 122.6% while over that same period Greater Toronto has seen price appreciation of only 58.1%, Oakville-Milton 61.0%, and Hamilton-Burlington 85.2%. Closing the gap.
It will be interesting to see what happens in the marketplace over the next few months. All things being equal, I would expect to continue to see strong price gains over the next year. But as I say, all things being equal. One thing we can’t predict but that needs to be factored in is Government intervention. Both the Federal and Provincial Governments are making rumblings of an ‘overheated real estate market’. So, I’m afraid we are in for some changes in 2022. Stay tuned.