September 15th 2023
The sales figures are in for August, and at first brush they are quite alarming. Substantial month-over-month drops in almost every municipality! St. Catharines is down $30,277 or 4.53%, Niagara Falls is down $67,057 or 9.80%, Fort Erie is down $59,352 or 8.56%, Welland is down $51,894 or 8.44%, Thorold is down $38,944 or 6.12%. And the Niagara Region as a whole is down $37,048 or 5.16%. And that’s in just one month.
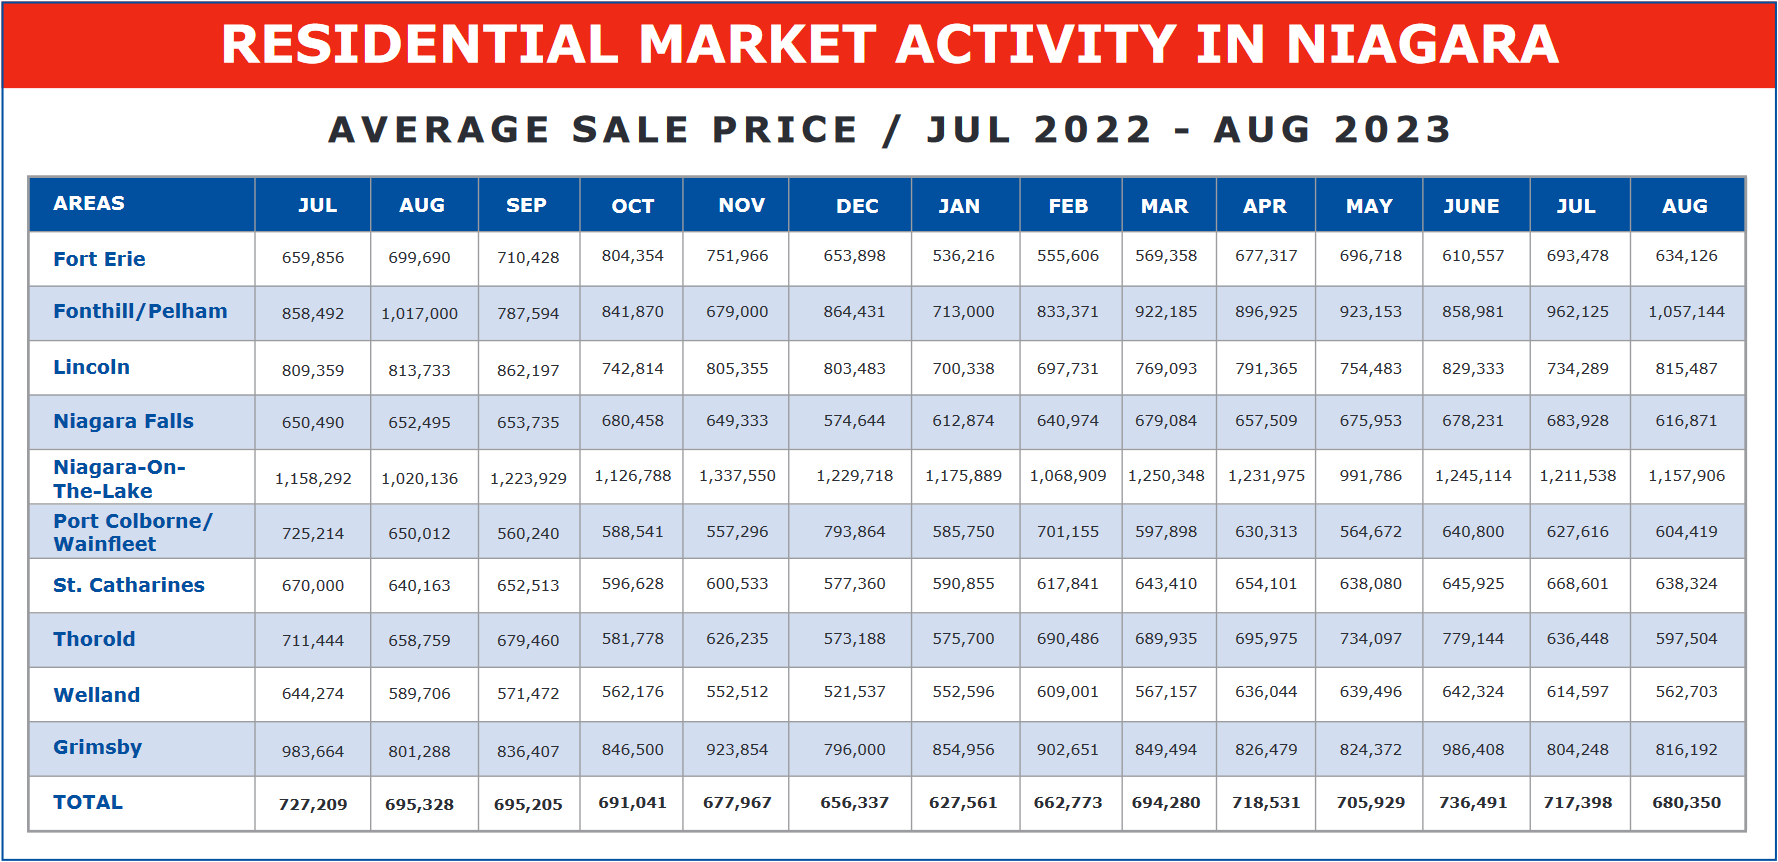
But delving deeper into it, we find that it is not as dismal a picture as the chart would suggest. There are really two dynamics at play when making up the average sale price of homes in any given month. The one is an actual drop in property values. And that is what we would first assume was going on. But another very real fact is that with interest rates rising, people simply can’t afford as much house as they once could. And so, rather than paying less for any given house, they are opting to buy less house. Perhaps a semi-detached instead of a detached home, or one with less square footage, or in a slightly less desirable area. And that’s exactly what has been happening.
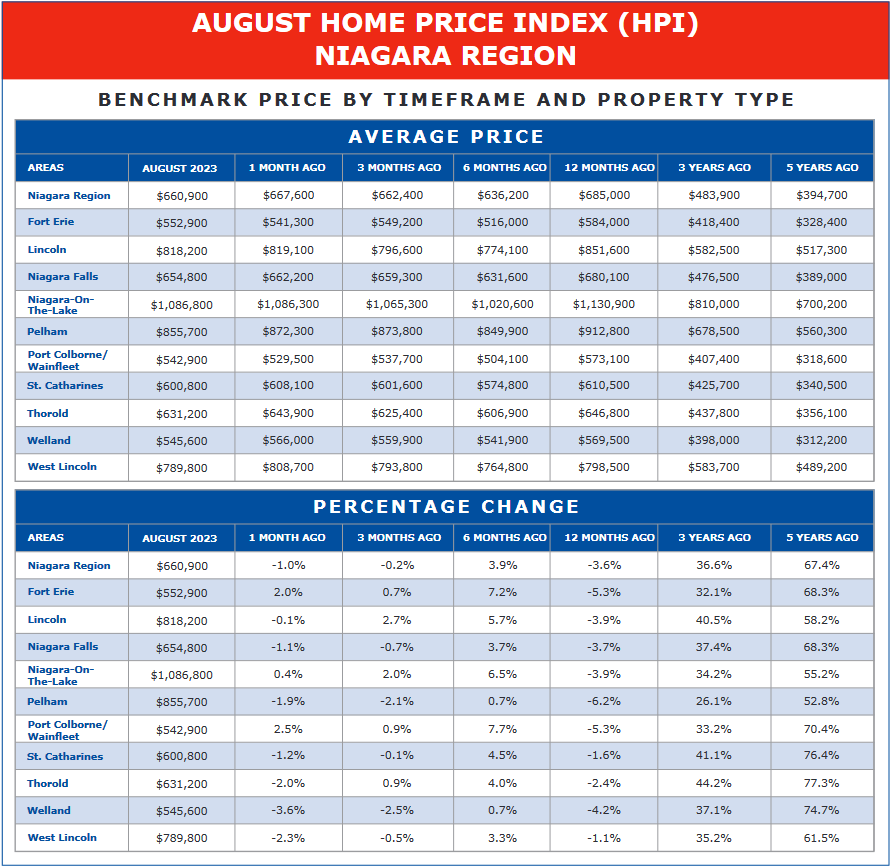
I have mentioned previously that the Board, in an attempt to track this exact thing, has been publishing H.P.I. (Home Price Index) rather than the average sale price. This is more precise in that it compares very similar properties rather than all sales (3 B.R. brick homes with 2 baths and a single garage for example). The reason I don’t use it in our monthly analysis is because I go back years, and H.P.I. is a relatively new approach. I want consistency from year to year.
But look at what H.P.I. indicates for the month of August.
 E
E
Quite a different picture. Here we see the actual price drop for any given property type is much more modest: $7,300 or 1.20% for St. Catharines, $7,400 or 1.11% for Niagara Falls, and $6,700 or 1.00% across the region. So, in actual fact, house by house the prices across the region have remained pretty steady. But people’s buying power has declined as they face mortgages around 6% where not too long ago they were under 2%.
Another indicator of the relative strength or weakness of the marketplace is the number of units sold in any given month.
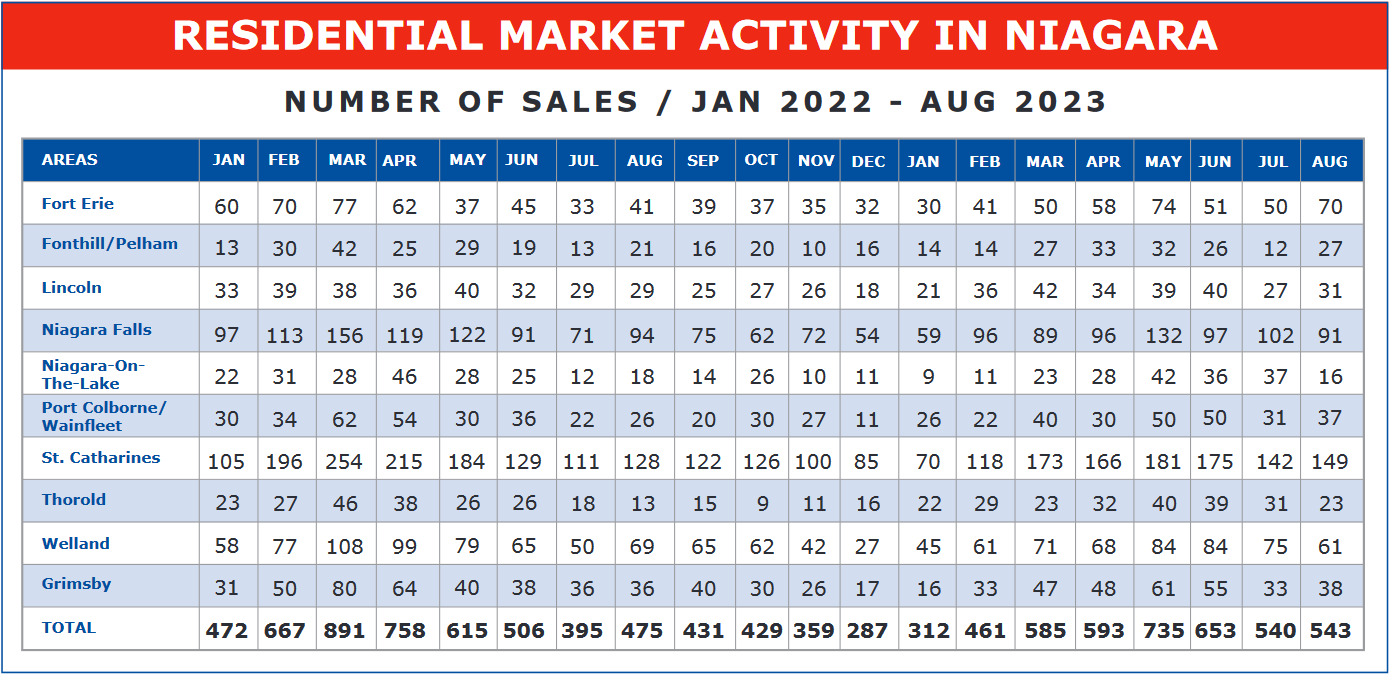
Here we see in August a total of 543 units were sold. This is up 68 units or 14.32% from one year ago when prices were in free-fall, but down from the heady days of August 2021 by 236 units or 30.30%. It is actually consistent with the previous month and that’s a positive sign since August generally registers fewer sales than July and begins a downward slide to the end of the year.
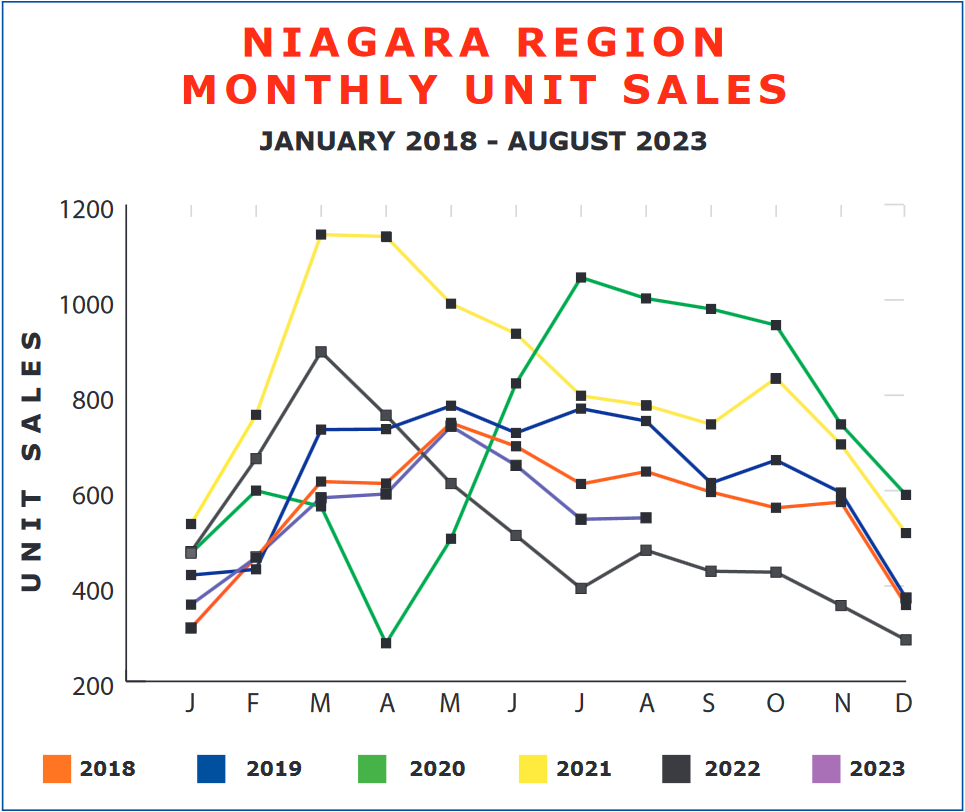
So, in spite of rising interest rates, people are continuing to buy in this market at a pretty steady pace. Overall, the number of sales, while down from the boom due to the lack of investors’ participation, are pretty solid. The market is in a steady holding pattern. No doubt we’ll see reduced activity as we approach the end of the year, but that is seasonal, not economic. And as for what’s ahead, a lot depends on the Bank of Canada. A stability of interest rates will be a good first step, and an easing up, whenever that happens, will raise the affordability bar once again. And, I believe, as that happens, we’ll see the volume of sales rise substantially as well.