September 15th 2025
Although there are no real surprises in the sales stats that came in for August, there are a few items of note. The first involves price. The overall feeling among realtors, and in fact in some reports coming in across the country, is that prices are sliding. But that is not totally accurate.
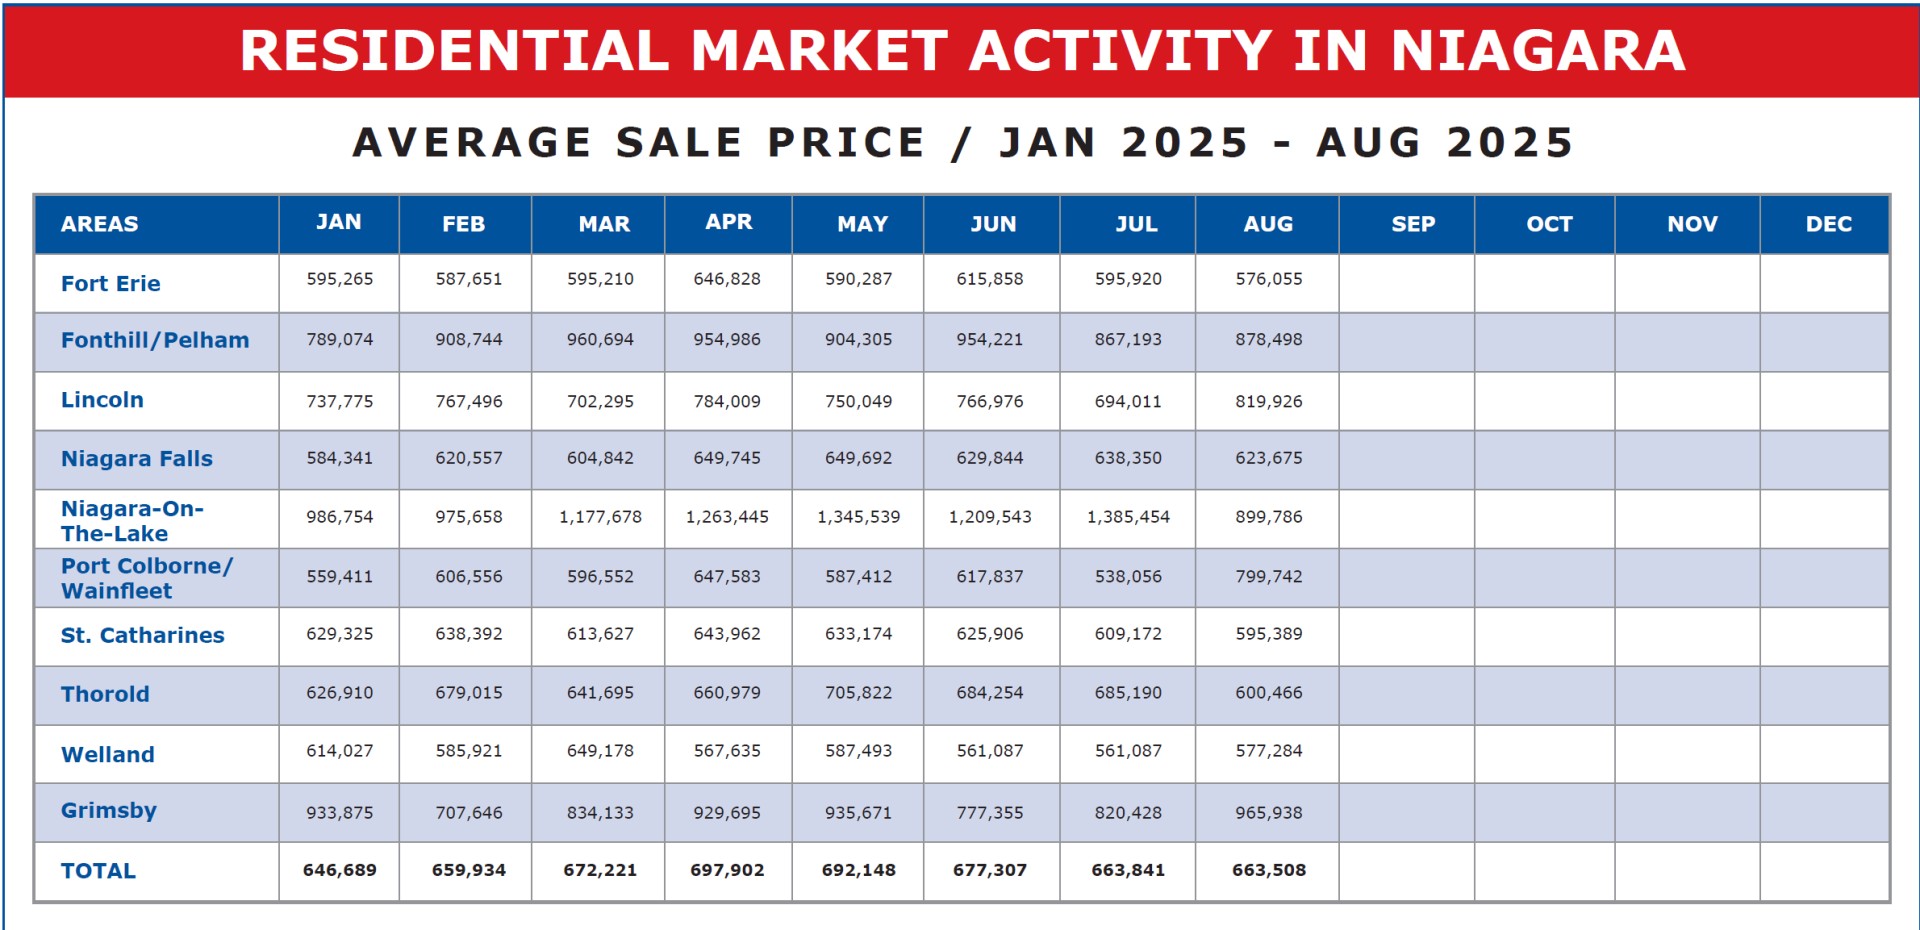
What we see first of all is that across the region, the average price came in pretty much the same as it was in July. $663,508 vs. $663,841. But that result is a bit like standing with one foot in a bucket of ice water and the other in a bucket of boiling water. The resulting average might be lukewarm, but it sure doesn’t feel that way. Take a minute to look at the individual numbers. Niagara-on-the-Lake went down to $899,786 from $1,385,454 in July. In August, Grimsby is coming in at $965,938, which is up significantly from $820,428 in July. Of course, these are smaller markets with much fewer unit sales to make up the average. But it’s interesting that the two largest markets in terms of unit sales, St. Catharines and Niagara Falls, are both down in average sale price in August compared to July. Niagara Falls by $14,675 or 2.30% and St. Catharines by $13,783 or 2.26%. Of the ten municipalities tracked, five are up month over month and five are down. And that pretty well sums up the market. Unsettled. Some no doubt reflect changes in buying patterns. You can be sure prices in Niagara-on-the-Lake didn’t drop by $485,668 or 35% between July and August. It’s simply that of the 21 homes sold there in August, fewer were upper-end homes. But if we’re having trouble making sense out of these numbers, imagine how the buying and selling public must be struggling.
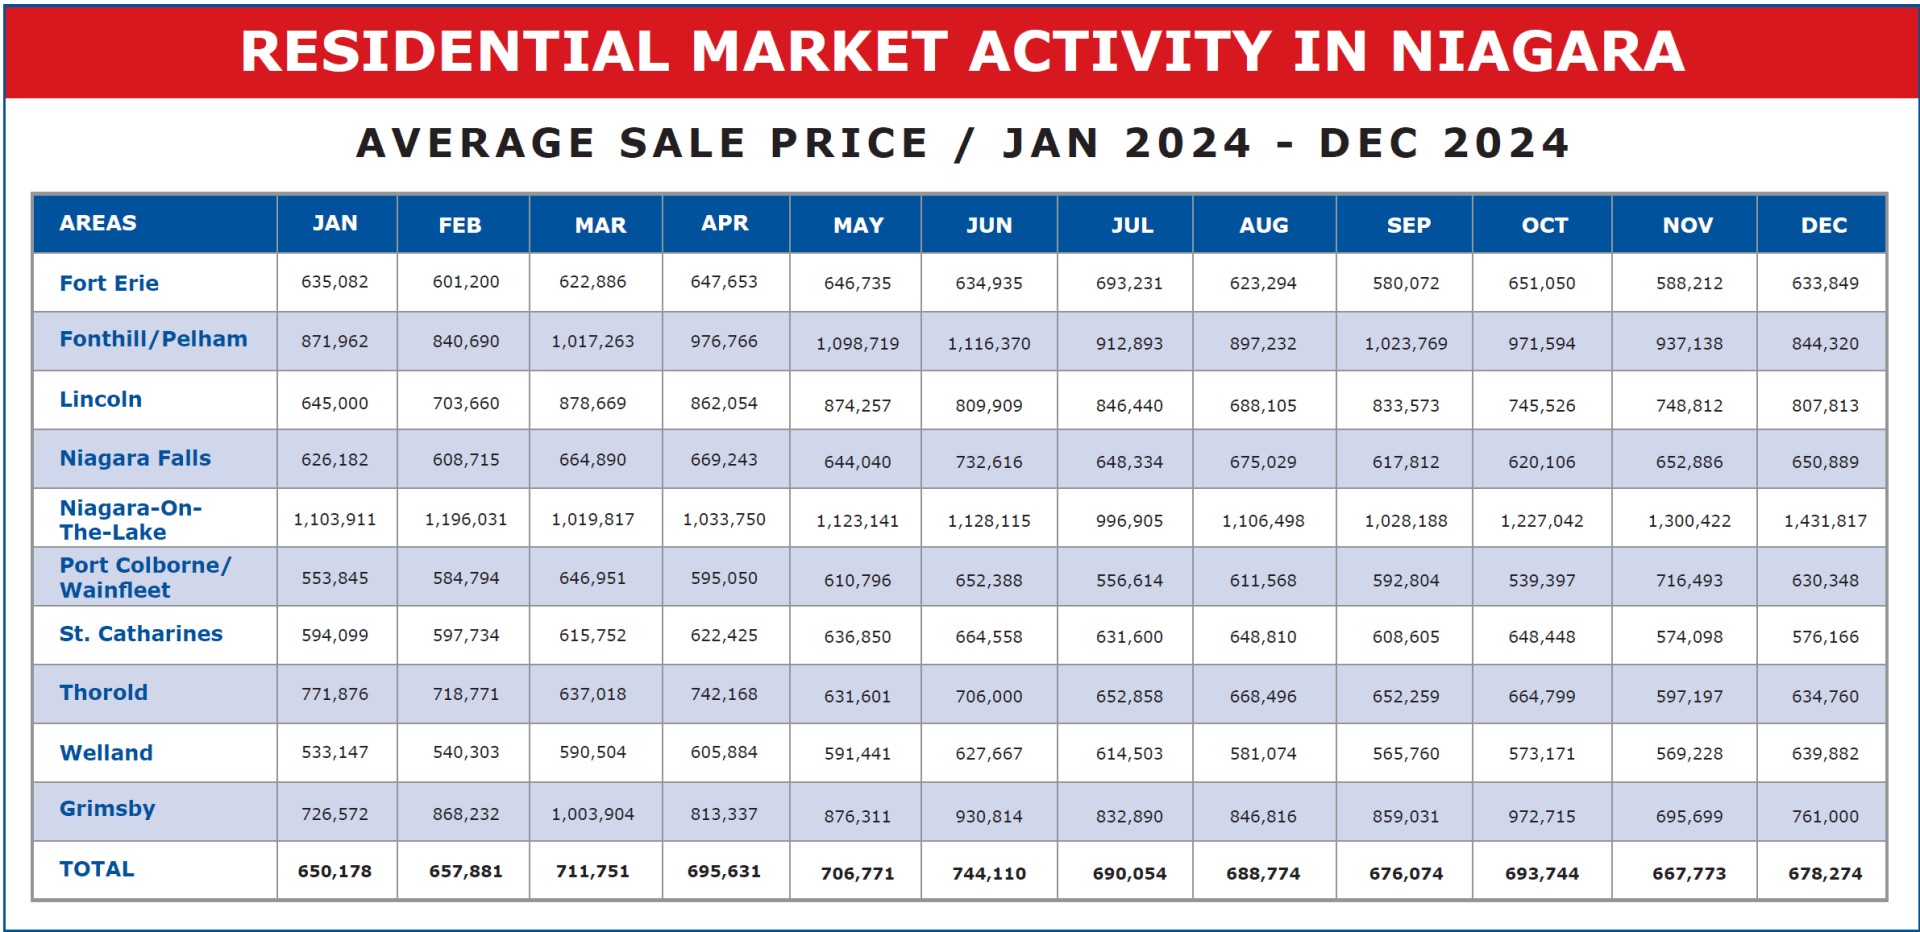
As we’ve stated, since the post-COVID era began, prices have risen in the first half of the year and fallen in the second half. Last year, the second-half slide was more modest than it was in 2023. Much like this year, in 2024, the drop in price from July to August was only $1,280 or 0.19% and only fell a further $10,500 or 1.5% by the end of the year. I suspect that’s what we’ll see for the balance of this year as well. Basically, price stability with a minor decrease between now and year-end. At this point, we are still above the $646,689 registered in January, but down from the 2024 year-end figure of $678,274, and down $25,266 from the $688,774 registered last August.
On the unit sales front, August showed a significant decline in sales from July, coming in at 527 units compared to the 648 logged in July. That’s a drop of 121 units or 18.7%
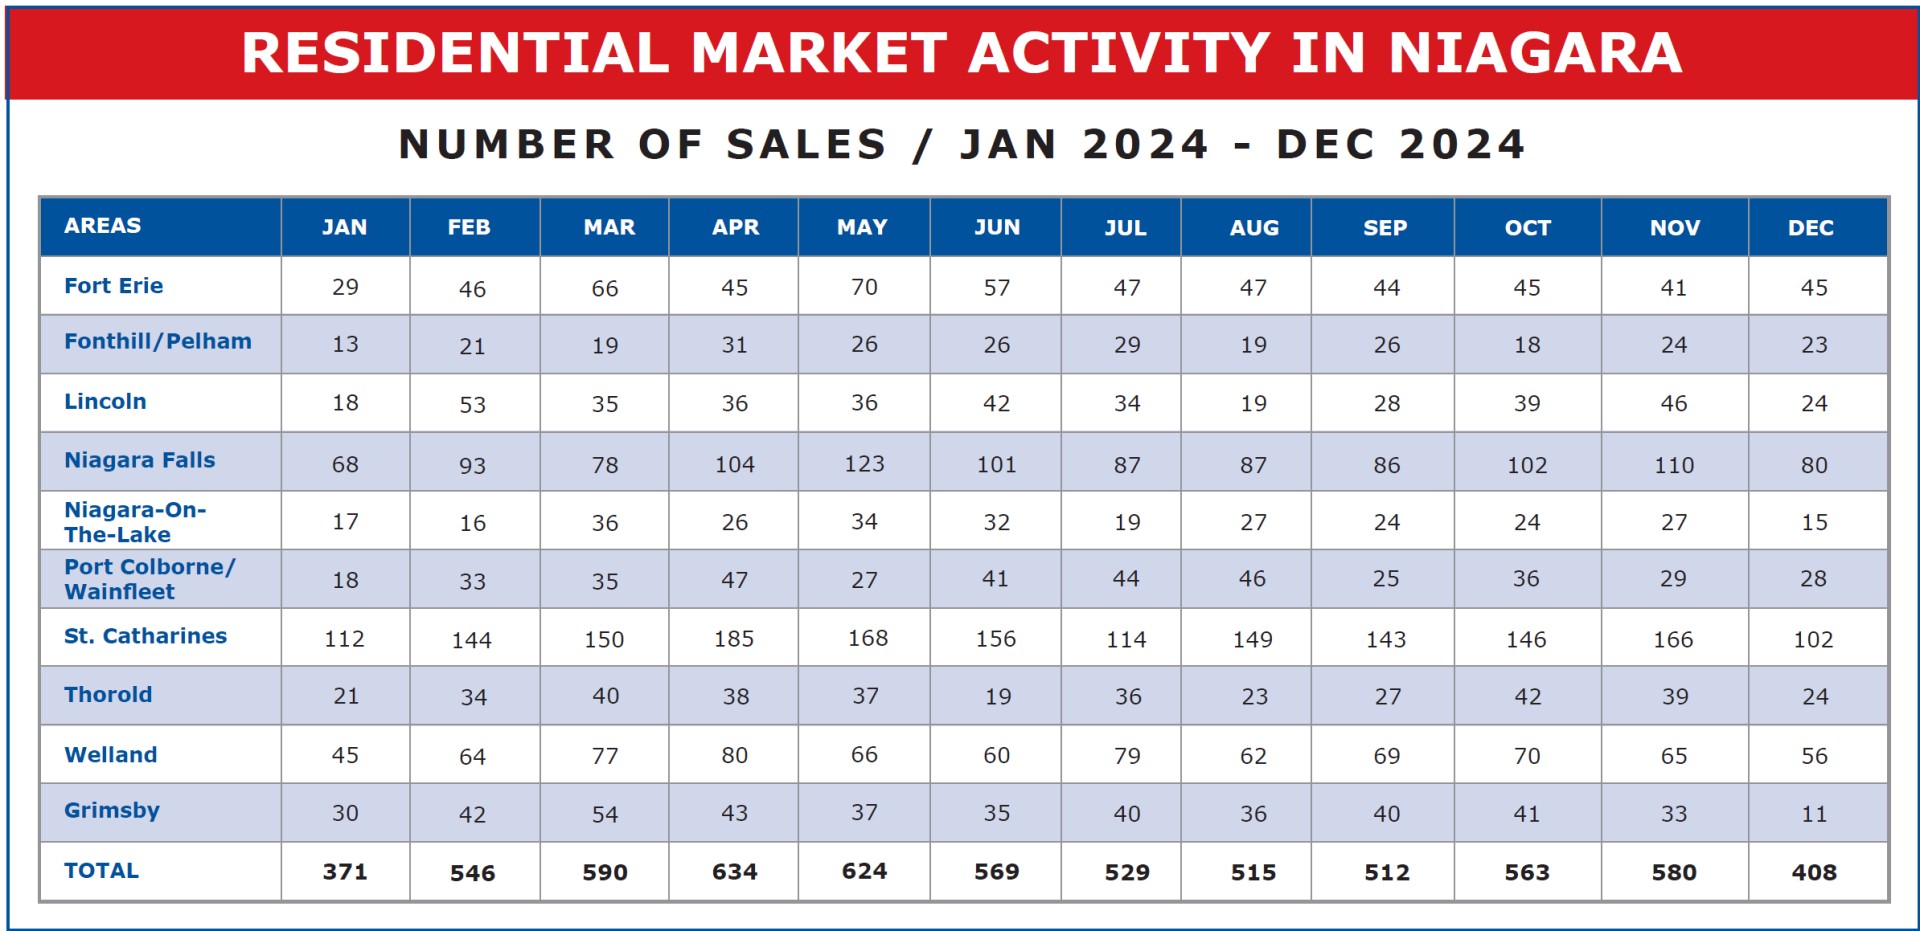
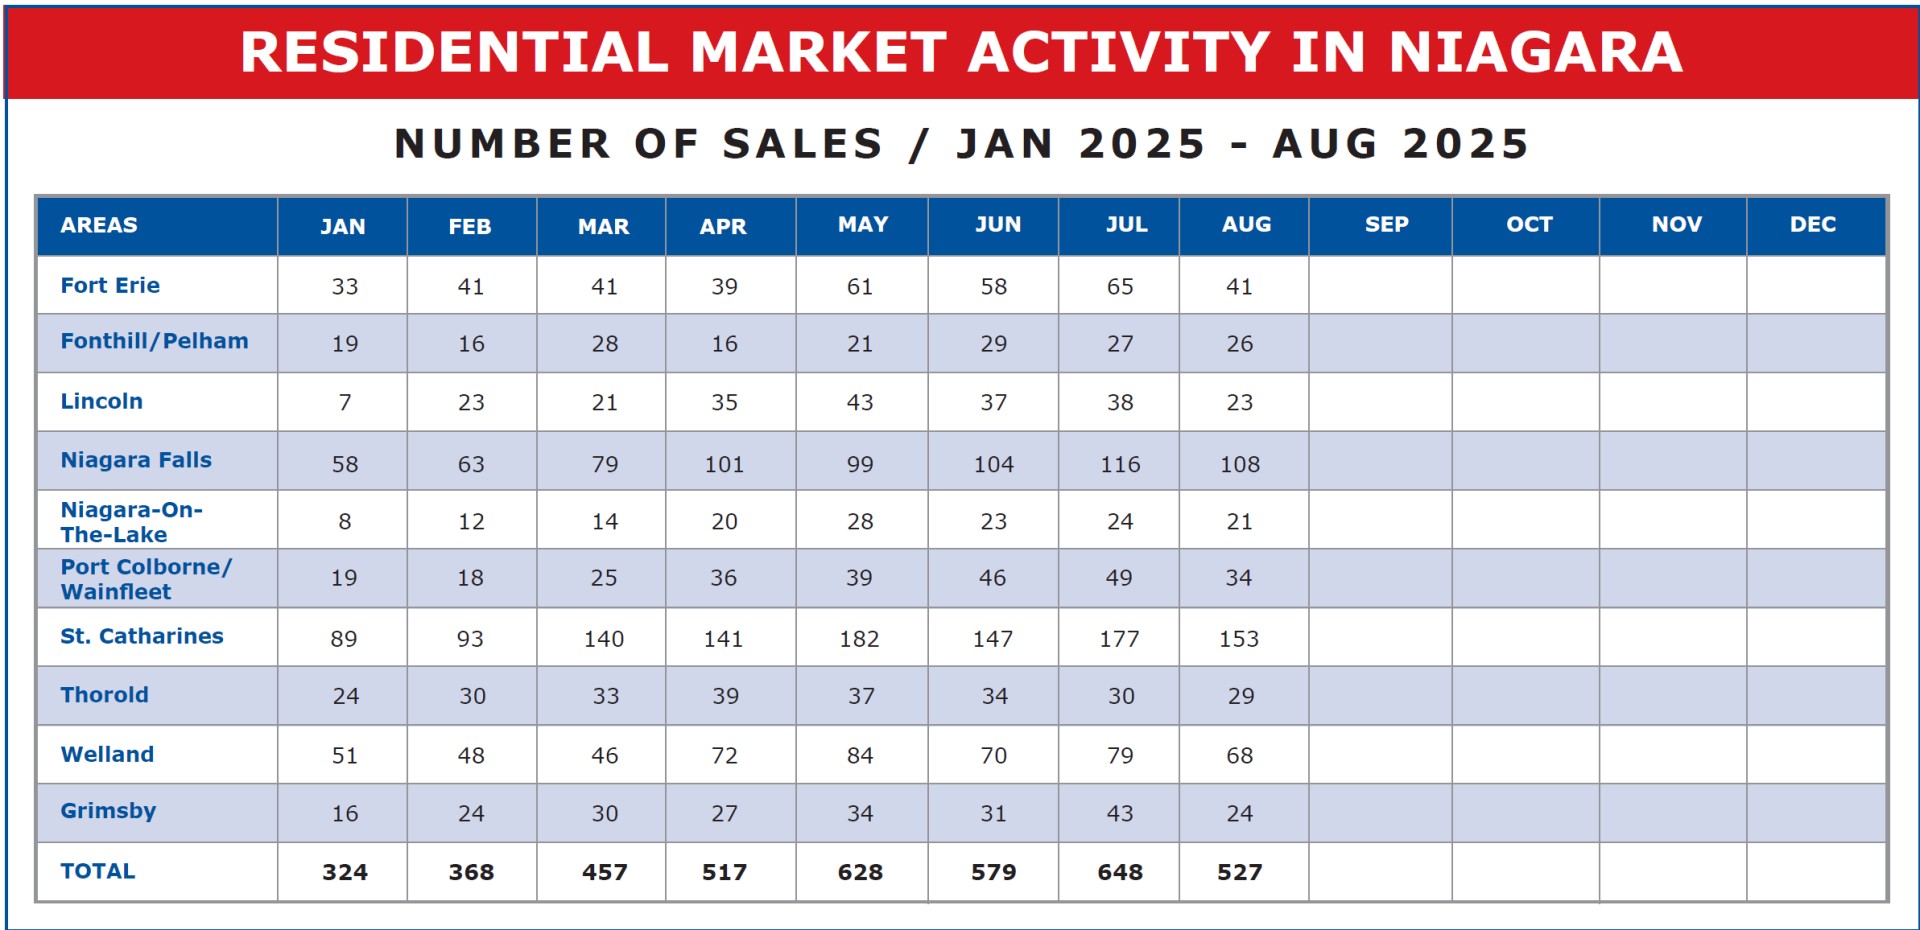
Last year, the drop in units sold from July to August was much more modest, only 14 units. I suspect this year’s numbers are more due to the very high number of sales tallied up in July, the highest of the entire year. This August is more in line with, but still up from, the 515 registered last August. Moving on into the fall, it is typical to see unit sales declin, and I’m sure that will be the case again as we move into the colder months.